

Homework Answers


Add Answer to:
Use the following information to complete steps (a) through (d) below. A random sample of ny...
14. Use the following information to complete steps (a) through (d) below. A random sample of...
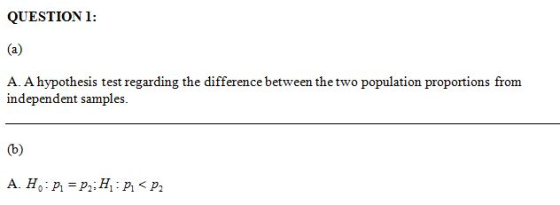
 14. Use the following information to complete steps (a) through (d) below. A random sample of n = 135 individuals results in x1 = 40 successes. An independent sample of n2 = 140 individuals results in X2 = 60 successes. Does this represent sufficient evidence to conclude that p1 <P2 at the a=0.05 level of significance? (a) What type of test should be used? O A. A hypothesis test regarding the difference between two population proportions from independent samples. OB....
> Use the following information to complete steps (a) through (d) below. A random sample of...
 > Use the following information to complete steps (a) through (d) below. A random sample of n = 110 individuals results in xy = 40 successes. An independent sample of n2 = 160 individuals results in X2 = 60 successes. Does this represeot sufficient evidence to conclude that p, <P2 at the a= 0.01 level of significance? (a) What type of test should be used? O A. A hypothesis best regarding the difference between two population proportions from dependent samples....
Use the following information to complete steps (a) through (d) below. A random sample of size...
 Use the following information to complete steps (a) through (d) below. A random sample of size n = 31 results in a sample mean of 123.3 and a sample standard deviation of 8.5. An independent sample of size n2 = 50 results in a sample mean of 129.8 and sample standard deviation of 7.3. Does this constitute sufficient evidence to conclude that the population means differ at the x = 0.005 level of significance? (a) What type of test should...
Test whether 14 <H2 at the c = 0.05 level of significance for the sample data...
 Test whether 14 <H2 at the c = 0.05 level of significance for the sample data shown in the accompanying table. Assume that the populations are normally distributed. B! Click the icon to view the data table, Determine the null and alternative hypothesis for this test. Sample Data O A. Ho:H1 = H2 H:H *H2 OB. Ho H1 H2 HEM1 =12 @ C. Hp-Hifl2 H:H1 H2 OD. Ho H1 = H2 H:H1 <H2 n Population 1 31 103.5 12.3 Population...
Conduct the following test at the a = 0.01 level of significance by determining (a) the...
 Conduct the following test at the a = 0.01 level of significance by determining (a) the null and alternative hypotheses, (b) the test statistic, and (c) the P-value. Assume that the samples were obtained independently using simple random sampling. Test whether P1 * P2. Sample data are xy = 28, n = 254, X2 = 38, and n2 = 301. (a) Determine the null and alternative hypotheses. Choose the correct answer below. O A. Ho: P1 = P2 versus Hy:...
Conduct a test at the a = 0.10 level of significance by determining (a) the null...
 Conduct a test at the a = 0.10 level of significance by determining (a) the null and alternative hypotheses, (b) the test statistic, and (c) the P-value. Assume the samples were obtained independently from a large population using simple random sampling. Test whether 21 > P2. The sample data are x1 = 127, ny = 241, X2 = 131, and n2 = 318. (a) Choose the correct null and alternative hypotheses below. O A. Ho: P1 = P2 versus Hy:...
Test whether Hy <H2 at the a=0.05 level of significance for the sample data shown in...
 Test whether Hy <H2 at the a=0.05 level of significance for the sample data shown in the accompanying table. Assume that the populations are normally distributed. Click the icon to view the data table. Determine the null and alternative hypothesis for this test. Sample Data O A. Ho:P1 = H2 H7:41 +42 OB. Ho:14 42 H1 H1 H2 n Population 1 31 103.5 12.3 Population 2 25 114.5 © C. How * P2 HM1 <H2 OD. Ho H1 H2 H1:21...
Test whether at the 0.01 level of significance for the sample data shown in the accompanying...
 Test whether at the 0.01 level of significance for the sample data shown in the accompanying table Assume that the populations are normally distributed Click the icon to view the datatable Determine the null and alternative hypothesis for this test OA. HOR Sample Data - X OB. Het Ha OCH 12 n Population 1 33 1035 123 Population 2 25 1145 133 OD. HE 2 Hyh Print Done Determine the value for this hypothesis test P-Round to three decimal places...
Conduct the following test at the a = 0.01 level of significance by determining (a) the...
 Conduct the following test at the a = 0.01 level of significance by determining (a) the null and alternative hypotheses, (b) the test statistic, and (c) the P-value. Assume that the samples were obtained independently using simple random sampling. Test whether p1 #P2. Sample data are X7 = 30, n = 254, X2 = 36, and n2 = 301. (a) Determine the null and alternative hypotheses. Choose the correct answer below. O A. Ho: P1 = P2 versus H: P1>P2...
5. Conduct a test at the a=0,01 level of significance by determining (a) the null and...
 5. Conduct a test at the a=0,01 level of significance by determining (a) the null and alternative hypotheses, (b) the test statistic, and (c) the P-value. Assume the samples were obtained independently from a large population using simple random sampling. Test whether P, > P2. The sample data are xy = 116, n = 251, x2 = 132, and n2 = 301 (a) Choose the correct null and alternative hypotheses below. O A. Ho: P1 = P2 versus H: PHP2...
 14. Use the following information to complete steps (a) through (d) below. A random sample of n = 135 individuals results in x1 = 40 successes. An independent sample of n2 = 140 individuals results in X2 = 60 successes. Does this represent sufficient evidence to conclude that p1 <P2 at the a=0.05 level of significance? (a) What type of test should be used? O A. A hypothesis test regarding the difference between two population proportions from independent samples. OB....
 > Use the following information to complete steps (a) through (d) below. A random sample of n = 110 individuals results in xy = 40 successes. An independent sample of n2 = 160 individuals results in X2 = 60 successes. Does this represeot sufficient evidence to conclude that p, <P2 at the a= 0.01 level of significance? (a) What type of test should be used? O A. A hypothesis best regarding the difference between two population proportions from dependent samples....
 Use the following information to complete steps (a) through (d) below. A random sample of size n = 31 results in a sample mean of 123.3 and a sample standard deviation of 8.5. An independent sample of size n2 = 50 results in a sample mean of 129.8 and sample standard deviation of 7.3. Does this constitute sufficient evidence to conclude that the population means differ at the x = 0.005 level of significance? (a) What type of test should...
 Test whether 14 <H2 at the c = 0.05 level of significance for the sample data shown in the accompanying table. Assume that the populations are normally distributed. B! Click the icon to view the data table, Determine the null and alternative hypothesis for this test. Sample Data O A. Ho:H1 = H2 H:H *H2 OB. Ho H1 H2 HEM1 =12 @ C. Hp-Hifl2 H:H1 H2 OD. Ho H1 = H2 H:H1 <H2 n Population 1 31 103.5 12.3 Population...
 Conduct the following test at the a = 0.01 level of significance by determining (a) the null and alternative hypotheses, (b) the test statistic, and (c) the P-value. Assume that the samples were obtained independently using simple random sampling. Test whether P1 * P2. Sample data are xy = 28, n = 254, X2 = 38, and n2 = 301. (a) Determine the null and alternative hypotheses. Choose the correct answer below. O A. Ho: P1 = P2 versus Hy:...
 Conduct a test at the a = 0.10 level of significance by determining (a) the null and alternative hypotheses, (b) the test statistic, and (c) the P-value. Assume the samples were obtained independently from a large population using simple random sampling. Test whether 21 > P2. The sample data are x1 = 127, ny = 241, X2 = 131, and n2 = 318. (a) Choose the correct null and alternative hypotheses below. O A. Ho: P1 = P2 versus Hy:...
 Test whether Hy <H2 at the a=0.05 level of significance for the sample data shown in the accompanying table. Assume that the populations are normally distributed. Click the icon to view the data table. Determine the null and alternative hypothesis for this test. Sample Data O A. Ho:P1 = H2 H7:41 +42 OB. Ho:14 42 H1 H1 H2 n Population 1 31 103.5 12.3 Population 2 25 114.5 © C. How * P2 HM1 <H2 OD. Ho H1 H2 H1:21...
 Test whether at the 0.01 level of significance for the sample data shown in the accompanying table Assume that the populations are normally distributed Click the icon to view the datatable Determine the null and alternative hypothesis for this test OA. HOR Sample Data - X OB. Het Ha OCH 12 n Population 1 33 1035 123 Population 2 25 1145 133 OD. HE 2 Hyh Print Done Determine the value for this hypothesis test P-Round to three decimal places...
 Conduct the following test at the a = 0.01 level of significance by determining (a) the null and alternative hypotheses, (b) the test statistic, and (c) the P-value. Assume that the samples were obtained independently using simple random sampling. Test whether p1 #P2. Sample data are X7 = 30, n = 254, X2 = 36, and n2 = 301. (a) Determine the null and alternative hypotheses. Choose the correct answer below. O A. Ho: P1 = P2 versus H: P1>P2...
 5. Conduct a test at the a=0,01 level of significance by determining (a) the null and alternative hypotheses, (b) the test statistic, and (c) the P-value. Assume the samples were obtained independently from a large population using simple random sampling. Test whether P, > P2. The sample data are xy = 116, n = 251, x2 = 132, and n2 = 301 (a) Choose the correct null and alternative hypotheses below. O A. Ho: P1 = P2 versus H: PHP2...
Most questions answered within 3 hours.
-
For the purposes of this assignment, you are to choose an
adaptive trait common to more...
asked 7 minutes ago -
Two identical flutes can play middle C (262 Hz) at 20◦C. How
many beats per second...
asked 15 minutes ago -
Potassium phosphate and calcium chloride react in a double
replacement reaction. To produce 1.0 moles of...
asked 10 minutes ago -
Sparky, Co. purchased land as a factory site for $600,000.
Sparky paid $42,000 to tear down...
asked 24 minutes ago -
A Chi-square distribution with 14 degrees of freedom is a
correct model for
Question 8 options:...
asked 54 minutes ago -
In a group of 45 mice, there are 10 that have a certain genetic
character. suppose...
asked 35 minutes ago -
Topic: Hydrogenic Atoms
The wavefunction of one of the d orbitals is proportional to sin
θ...
asked 35 minutes ago -
6. Suppose that the Bank of Canada conducts an open market
purchase of $2000 from a...
asked 50 minutes ago -
A) Suppose U=X∙Y3. Find X* and Y*.
B) Suppose U=X3∙Y. Find X* and Y*.
C) Suppose...
asked 59 minutes ago -
The only quantities of good 1 that Barbara can buy are 1 unit or
zero units....
asked 48 minutes ago -
c. Node Admittance matrix and its use in different calculations
of power transmission system. Display the...
asked 56 minutes ago -
Try to get the code down to less than 40 lines. (PYTHON)
import random
fave_number =...
asked 56 minutes ago