The U.S. Census Bureau computed the proportion of U.S residents who live in each of the...
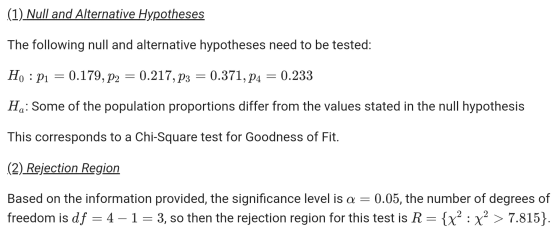
The U.S. Census Bureau computed the proportion of U.S residents who live in each of the four geographic regions in 2010. Then a simple random sample was drawn of 1000 people living in the U.S. in 2018. The following table presents the results:
| Region | 2010 Proportion | 2018 Frequency |
| Northeast | 0.179 | 173 |
| Midwest | 0.217 | 205 |
| South | 0.371 | 384 |
| West | 0.233 | 238 |
Determine whether the proportions of people living in the U.S. in the various regions has changed between 2010 and 2018. Use a 0.05 level of significance.
Prompt 1: Null Hypothesis
Prompt 1 Answer
Prompt 2: Number of degrees of freedom?
Prompt 2 Answer
Prompt 3: P-value
Prompt 3 Answer
Prompt 4Has the proportion of people living in the different regions of the U.S. changed from 2010 to 2018?
prompt 4: answer
Homework Answers
H0: The proportion of people living in different region in 2010 and 2018 is same.
H0: the proportion of people living in different region has changed between 2010 and 2018.


 thus it may concluded that the
proportion of people living in different region has not changed
over 2010 to 2018.
thus it may concluded that the
proportion of people living in different region has not changed
over 2010 to 2018.
I have given my best to solve your problem. Please like the answer if you are satisfied with it. ?
Add Answer to:
The U.S. Census Bureau computed the proportion of U.S residents
who live in each of the...
1) A statistics teacher claims that, on average, 20% of students in his class get an...
1) A statistics teacher claims that, on average, 20% of students in his class get an A, 25% get a B, 35% get a C, 10% get a D and the rest get an F. The grades of a random sample of his students over the years is recorded. Test the claim at 10% significance. Round to the fourth as needed. Categories Observed Frequency Expected Frequency A 56 B 40 C 105 D 16 F 16 Test Statistic: Degrees of...
Most questions answered within 3 hours.
-
Myca Corp. has a project with the following cash flows. What is
the value of the...
asked 8 minutes ago -
When an object moves through a fluid, the fluid exerts a viscous
force F on the...
asked 2 hours ago -
Why did the observed chemistry of thallium mislead Mendelev to
place the group 13 element (Tl)...
asked 3 hours ago -
A sine wave signal is displayed on the screen of an
oscilloscope. 6 peak-to-peak divisions are...
asked 5 hours ago -
a
1500 kg car accelerates from 0 to 25 m / s in 21.0s. How much...
asked 6 hours ago -
Calculate the molarity of each of the following solutions:
(a) 30.5 g of ethanol (C2H5OH) in...
asked 6 hours ago -
1 Refer to the build-borrow-or-buy framework as a decision tree
for the Adidas company. Identify a...
asked 7 hours ago -
Problem 2: The Problem of Social Cost. A Rancher and Farmer live
side-by-side to each other....
asked 8 hours ago -
a uniform bar of weight 40N is 4 meter long. weights
on 60N and 100N are...
asked 8 hours ago -
Define Diet counceling? What are the
responsibilities of a counselor?
asked 10 hours ago -
Hey im just confused about how to put the ' A angle n' and ' S...
asked 10 hours ago -
A short essay about the WSJ article on Oreo versus Hydrox.
asked 10 hours ago