The mean number of English courses taken in a two-year time period by male and female...
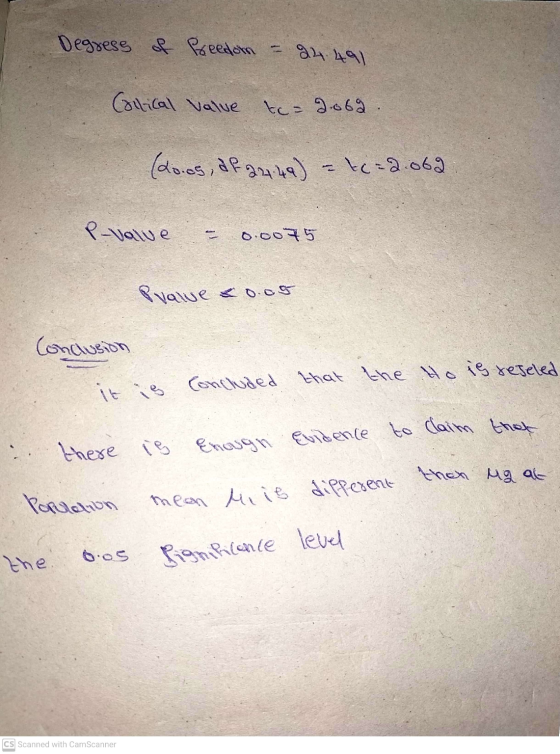
The mean number of English courses taken in a two-year time period by male and female college students is believed to be about the same. An experiment is conducted and data are collected from 29 males and 16 females. The males took an average of two English courses with a standard deviation of 0.9. The females took an average of three English courses with a standard deviation of 1.2. Are the means statistically the same? (Use
α = 0.05)
NOTE: If you are using a Student's t-distribution for the problem, including for paired data, you may assume that the underlying population is normally distributed. (In general, you must first prove that assumption, though.)
a.) State the distribution to use for the test. (Enter your answer in the form z or tdf where df is the degrees of freedom. Round your answer to two decimal places.)
I got t43 and it's wrong
Homework Answers

Add Answer to:
The mean number of English courses taken in a two-year time
period by male and female...
PLEASE ANSWER ALL PARTS The mean number of English courses taken in a two-year time period...
PLEASE ANSWER ALL PARTS The mean number of English courses taken in a two-year time period by male and female college students is believed to be about the same. An experiment is conducted and data are collected from 29 males and 16 females. The males took an average of four English courses with a standard deviation of 0.8. The females took an average of five English courses with a standard deviation of 1.1. Are the means statistically the same? (Use...
The mean number of sick days an employee takes per year is believed to be about 10. Members of a personnel department do not believe this figure. They randomly survey 8 employees. The number of sick...
 The mean number of sick days an employee takes per year is believed to be about 10. Members of a personnel department do not believe this figure. They randomly survey 8 employees. The number of sick days they took for the past year are as follows: 10; 5;15; 5; 11; 10; 8; 10. Let x the number of sick days they took for the past year. Should the personnel team believe that the mean number is about 10? Conduct a...
In a particular year, 68% of online courses taught at a system of community colleges were...
In a particular year, 68% of online courses taught at a system of community colleges were taught by full-time faculty. To test if 68% also represents a particular state's percent for full-time faculty teaching the online classes, a particular community college from that state was randomly selected for comparison. In that same year, 35 of the 44 online courses at this particular community college were taught by full-time faculty. Conduct a hypothesis test at the 5% level to determine if...
Psychologists at an university compared the levels of alcohol consumption of male and female freshman students....
 Psychologists at an university compared the levels of alcohol consumption of male and female freshman students. Each student was asked to estimate the amount of alcohol (beer, wine, or liquor) they consume in a typical week. Summary statistics for 125 males and 182 females are provided in the accompanying table Click here to view the table a. For each gender, find a 95% confidence interval for mean weekly alcohol consumption For males, the 95% confidence interval is ( (Round to...
Suppose that an accounting firm does a study to determine the time needed to complete one person's tax forms. It randomly surveys 200 people. The sample average is 23.7 hours. There is a known population standard deviation of 6.0 hours. The population dis
 DETAILSIDCOLLABSTAT2 8.HW.006.MY NOTESASK YOUR TEACHERPRACTICE ANOTHERSuppose that an accounting firm does a study to determine the time needed to complete one person's tax forms. It randomly surveys 200 people. The sample average is 23.7 hours. There is a known population standard deviation of 6.0 hours. The population distribution is assumed to be normal.NOTE: If you are using a Student's t-distribution, you may assume that the underlying population is normally distributed. (In general, you must first prove that assumption, though.)Part (a)(i) x = (ii) 𝜎 = (iii) 𝜎 x = (rounded to three decimal places)(iv) n = (v) n − 1 = Part (b)Part (c)Which...
10. Psychologists at an university compared the levels of alcohol consumption of male and female freshman...
 10. Psychologists at an university compared the levels of alcohol consumption of male and female freshman students. Each student was asked to estimate the amount of alcohol (beer, wine, or liquor) they consume in a typical week. Summary statistics for 129 males and 181 females are provided in the accompanying table Click here to view the table a. For each gender, find a 95% confidence interval for mean weekly alcohol consumption. For males, the 95% confidence interval is ( (Round...
Psychologists at an university compared the levels of alcohol consumption of male and female freshman students....
 Psychologists at an university compared the levels of alcohol consumption of male and female freshman students. Each student was asked to estimate the amount of alcohol (beer, wine, or liquor) they consume in a typical week. Summary statistics for 128 males and 184 females are provided in the accompanying table 囲Click here to view the table a. For each gender, find a 95% confidence interval for mean weekly alcohol consumption For males, the 95% confidence interval is (DD, (Round to...
Psychologists at an university compared the levels of alcohol consumption of male and female freshman students....
 Psychologists at an university compared the levels of alcohol consumption of male and female freshman students. Each student was asked to estimate the amount of alcohol (beer, wine, or liquor) they consume in a typical week. Summary statistics for 126 males and 184 females are provided in the accompanying table Click here to view the table a. For each gender, find a 95% confidence interval for mean weekly alcohol consumption For males, the 95% confidence interval is ( (Round to...
The mean age of De Anza College students in a previous term was 26.6 years old....
 The mean age of De Anza College students in a previous term was 26.6 years old. An instructor thinks the mean age for online students is older than 26.6. She randomly surveys 56 online students and finds that the sample mean the 5% level s 29.8 with a standard deviation of 2.1. Conduct a hypothesis test Note: If you are using a Student's t-distribution for the problem, you may assume that the underlying population is normally distributed. (In general, you...
Your statistics instructor claims that 60 percent of the students who take her Elementary Statistics class...
Your statistics instructor claims that 60 percent of the students who take her Elementary Statistics class go through life feeling more enriched. For some reason that she can't quite figure out, most people don't believe her. You decide to check this out on your own. You randomly survey 64 of her past Elementary Statistics students and find that 36 feel more enriched as a result of her class. Now, what do you think? Conduct a hypothesis test at the 5%...
 The mean number of sick days an employee takes per year is believed to be about 10. Members of a personnel department do not believe this figure. They randomly survey 8 employees. The number of sick days they took for the past year are as follows: 10; 5;15; 5; 11; 10; 8; 10. Let x the number of sick days they took for the past year. Should the personnel team believe that the mean number is about 10? Conduct a...
 Psychologists at an university compared the levels of alcohol consumption of male and female freshman students. Each student was asked to estimate the amount of alcohol (beer, wine, or liquor) they consume in a typical week. Summary statistics for 125 males and 182 females are provided in the accompanying table Click here to view the table a. For each gender, find a 95% confidence interval for mean weekly alcohol consumption For males, the 95% confidence interval is ( (Round to...
 10. Psychologists at an university compared the levels of alcohol consumption of male and female freshman students. Each student was asked to estimate the amount of alcohol (beer, wine, or liquor) they consume in a typical week. Summary statistics for 129 males and 181 females are provided in the accompanying table Click here to view the table a. For each gender, find a 95% confidence interval for mean weekly alcohol consumption. For males, the 95% confidence interval is ( (Round...
 Psychologists at an university compared the levels of alcohol consumption of male and female freshman students. Each student was asked to estimate the amount of alcohol (beer, wine, or liquor) they consume in a typical week. Summary statistics for 128 males and 184 females are provided in the accompanying table 囲Click here to view the table a. For each gender, find a 95% confidence interval for mean weekly alcohol consumption For males, the 95% confidence interval is (DD, (Round to...
 Psychologists at an university compared the levels of alcohol consumption of male and female freshman students. Each student was asked to estimate the amount of alcohol (beer, wine, or liquor) they consume in a typical week. Summary statistics for 126 males and 184 females are provided in the accompanying table Click here to view the table a. For each gender, find a 95% confidence interval for mean weekly alcohol consumption For males, the 95% confidence interval is ( (Round to...
 The mean age of De Anza College students in a previous term was 26.6 years old. An instructor thinks the mean age for online students is older than 26.6. She randomly surveys 56 online students and finds that the sample mean the 5% level s 29.8 with a standard deviation of 2.1. Conduct a hypothesis test Note: If you are using a Student's t-distribution for the problem, you may assume that the underlying population is normally distributed. (In general, you...
Most questions answered within 3 hours.
-
when 2053 j of heat is added to 46.3 g of hexane C6H14 the
temperature increases...
asked 28 seconds from now -
a)An ideal heat pump is being considered for use in heating an
environment with a temperature...
asked 16 seconds from now -
.
Convert the following pairs of voltage and current waveforms to
phasor form. Each pair of...
asked 1 minute ago -
I need new and unique answers, please. (Use your own words,
don't copy and paste), Please...
asked 2 minutes ago -
A 6.5 cm diameter ball has a terminal speed of 22 m/s. What is
the ball's...
asked 15 minutes ago -
Name two areas of the human body with the highest concentration
of lymph nodes and speculate...
asked 18 minutes ago -
Angel Corporation has $10,000,000 of
8.0% 25 year bonds dated May 1, 2018 with interest payable...
asked 53 minutes ago -
7.
________ involves individuals trading goods they already have or
providing services in exchange for something...
asked 57 minutes ago -
Share your research problem. What databases did you search as
you gathered evidence to support your...
asked 57 minutes ago -
what process occurs to form microspores and megaspores in flowering
plants?
asked 1 hour ago -
C++
I need to use the function getData to put in all my data using
arrays....
asked 1 hour ago -
A block is hung by a string from the inside roof of a van. When
the...
asked 1 hour ago