
Homework Answers
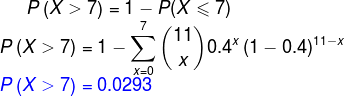
The number of AHC students  who live in Santa Maria out of 11 has Binomial distribution with
 .
.
The PMF of
is  .
.
a)The required probability is

b) Here we have to use Geometric distribution. The PMF is

The required probability is

c)Use Binomial distribution.
The required probability is
d) Here we have to use Geometric distribution.

Add Answer to:
HW 4.4 Score: 13.7/23 11/15 answered Question 12 < > Suppose that 40% of AHC students...
HW 4.4 Score: 13.7/23 11/15 answered X Question 11 < Score on last try: 0 of...
 HW 4.4 Score: 13.7/23 11/15 answered X Question 11 < Score on last try: 0 of 3 pts. See Details for more. > Next question Try a similar question You can retry this question below Suppose that 26% of students who take a class pass. You repeteadly ask students until you find one who passed. Find the probability that: Round to three decimals. a. The first person who passed is the 10 th or 15 th person you ask :...
HW 5.1,5.2 Score: 11.45/24 12/18 answered Question 15 Suppose that ages of people in a group...
 HW 5.1,5.2 Score: 11.45/24 12/18 answered Question 15 Suppose that ages of people in a group are uniformly distributed from 20 to 77 years old. You choose a person at random from this group. Find the probability that: Round answers to three decimals if needed. a. The person is younger than 37: b. The person is between 37 and 58 years old : c. Older than 58: Submit Question
HW 13.1-13.4 Score: 8.6/29 9/23 answered Question 16 < > Compute the STS (to two decimals)...
 HW 13.1-13.4 Score: 8.6/29 9/23 answered Question 16 < > Compute the STS (to two decimals) for a comparison of two population standard deviations or variances given that: a. The sample standard deviations are 14.8 for Population 1 and 15.1 for Population 2. F= b. The sample variances are 14.8 for Population 1 and 15.1 for Population 2. F=
UIC.CUCUIJCOLIITILISHIC/ JUULIZI HW 4.1,4.2 Score: 15.25/18 17/18 answered X Question 15 < Score on last try:...
 UIC.CUCUIJCOLIITILISHIC/ JUULIZI HW 4.1,4.2 Score: 15.25/18 17/18 answered X Question 15 < Score on last try: 0 of 1 pts. See Details for more. > Next question Try a similar question You can retry this question below A class of 27 students took a short quiz. 3 students missed no questions, 4 missed one question, 5 missed two questions, 7 missed three questions and 8 missed four questions. Find the expected number of missed questions for a randomly chosen student...
HW 6.2 Score: 15.8/26 16/18 answered Question 14 < > Salaries at a company are normally...
 HW 6.2 Score: 15.8/26 16/18 answered Question 14 < > Salaries at a company are normally distributed with a mean of $58000 and standard deviation $2000. Find the following. Round to one decimal if needed. a. The percentile of a salary of $55400: b. The cutoff for the top 18% of salaries: c. Out of a random sample of 82 salaries, how many would you expect to be between $55400 and $56600 : Submit Question
HW 5.1,5.2 Score: 16.95/24 15/18 answered Question 18 Suppose that tree heights in a forest are...
 HW 5.1,5.2 Score: 16.95/24 15/18 answered Question 18 Suppose that tree heights in a forest are uniformly distributed from 7 to 33 feet. Round answers to one decimal if needed. a. What is the 18th percentile for tree heights? b. What percentile is a tree 27 feet tall? c. What is the cutoff (in feet) for the tallest 18% of trees? d. Out of a random sample of 35 trees, how many would you expect to be more than 27...
HW 6.2 Score: 15.8/26 16/18 answered X Question 17 < > Score on last try: 0...
 HW 6.2 Score: 15.8/26 16/18 answered X Question 17 < > Score on last try: 0 of 3 pts. See Details for more. > Next question Try a similar question You can retry this question below 700 800 900 1000 1100 1200 130 SAT Scores Q Use the graph above to find the following. Round to one decimal if needed. a. Out of a random sample of 83 exams, how many you would expect to be between 1110 and 1190...
HW 13.1-13.4 Score: 15.2/29 13/23 answered Question 2 Find the P-value (to 4 decimals) for an...
 HW 13.1-13.4 Score: 15.2/29 13/23 answered Question 2 Find the P-value (to 4 decimals) for an F-test with d. f. = 11, d. f.d = 15 and STS F = 9.1 if the test is: a. Left tailed: b. Right tailed: C. Two-tailed: Submit Question
HW 4.1, 4.2 Score: 15.25/18 17/18 answered Question 18 < > Result 7,7,7 7,7,5 7,$,$ $,$,$...
 HW 4.1, 4.2 Score: 15.25/18 17/18 answered Question 18 < > Result 7,7,7 7,7,5 7,$,$ $,$,$ Payout ($) Probability 50 0.002 10 0.04 5 0.05 2 0.08 A $1.00 slot machine pays out according to the table above, with the corresponding probabilities. The machine only pays out if you get a result that includes "7" or "$". a. The expected payout per spin (to two decimals) is $ b. If you play this machine 50 times, your expected net loss...
HW 13.1-13.4 Score: 8.6/29 9/23 answered Question 15 > Compute the STS (to two decimals) for...
 HW 13.1-13.4 Score: 8.6/29 9/23 answered Question 15 > Compute the STS (to two decimals) for a comparison of two population standard deviations or variances given that: a. The sample standard deviations are 19.6 for Population 1 and 18.7 for Population 2. F= b. The sample variances are 19.6 for Population 1 and 18.7 for Population 2. Submit Question
 HW 4.4 Score: 13.7/23 11/15 answered X Question 11 < Score on last try: 0 of 3 pts. See Details for more. > Next question Try a similar question You can retry this question below Suppose that 26% of students who take a class pass. You repeteadly ask students until you find one who passed. Find the probability that: Round to three decimals. a. The first person who passed is the 10 th or 15 th person you ask :...
 HW 5.1,5.2 Score: 11.45/24 12/18 answered Question 15 Suppose that ages of people in a group are uniformly distributed from 20 to 77 years old. You choose a person at random from this group. Find the probability that: Round answers to three decimals if needed. a. The person is younger than 37: b. The person is between 37 and 58 years old : c. Older than 58: Submit Question
 HW 13.1-13.4 Score: 8.6/29 9/23 answered Question 16 < > Compute the STS (to two decimals) for a comparison of two population standard deviations or variances given that: a. The sample standard deviations are 14.8 for Population 1 and 15.1 for Population 2. F= b. The sample variances are 14.8 for Population 1 and 15.1 for Population 2. F=
 UIC.CUCUIJCOLIITILISHIC/ JUULIZI HW 4.1,4.2 Score: 15.25/18 17/18 answered X Question 15 < Score on last try: 0 of 1 pts. See Details for more. > Next question Try a similar question You can retry this question below A class of 27 students took a short quiz. 3 students missed no questions, 4 missed one question, 5 missed two questions, 7 missed three questions and 8 missed four questions. Find the expected number of missed questions for a randomly chosen student...
 HW 6.2 Score: 15.8/26 16/18 answered Question 14 < > Salaries at a company are normally distributed with a mean of $58000 and standard deviation $2000. Find the following. Round to one decimal if needed. a. The percentile of a salary of $55400: b. The cutoff for the top 18% of salaries: c. Out of a random sample of 82 salaries, how many would you expect to be between $55400 and $56600 : Submit Question
 HW 5.1,5.2 Score: 16.95/24 15/18 answered Question 18 Suppose that tree heights in a forest are uniformly distributed from 7 to 33 feet. Round answers to one decimal if needed. a. What is the 18th percentile for tree heights? b. What percentile is a tree 27 feet tall? c. What is the cutoff (in feet) for the tallest 18% of trees? d. Out of a random sample of 35 trees, how many would you expect to be more than 27...
 HW 6.2 Score: 15.8/26 16/18 answered X Question 17 < > Score on last try: 0 of 3 pts. See Details for more. > Next question Try a similar question You can retry this question below 700 800 900 1000 1100 1200 130 SAT Scores Q Use the graph above to find the following. Round to one decimal if needed. a. Out of a random sample of 83 exams, how many you would expect to be between 1110 and 1190...
 HW 13.1-13.4 Score: 15.2/29 13/23 answered Question 2 Find the P-value (to 4 decimals) for an F-test with d. f. = 11, d. f.d = 15 and STS F = 9.1 if the test is: a. Left tailed: b. Right tailed: C. Two-tailed: Submit Question
 HW 4.1, 4.2 Score: 15.25/18 17/18 answered Question 18 < > Result 7,7,7 7,7,5 7,$,$ $,$,$ Payout ($) Probability 50 0.002 10 0.04 5 0.05 2 0.08 A $1.00 slot machine pays out according to the table above, with the corresponding probabilities. The machine only pays out if you get a result that includes "7" or "$". a. The expected payout per spin (to two decimals) is $ b. If you play this machine 50 times, your expected net loss...
 HW 13.1-13.4 Score: 8.6/29 9/23 answered Question 15 > Compute the STS (to two decimals) for a comparison of two population standard deviations or variances given that: a. The sample standard deviations are 19.6 for Population 1 and 18.7 for Population 2. F= b. The sample variances are 19.6 for Population 1 and 18.7 for Population 2. Submit Question
Most questions answered within 3 hours.
-
This is C++ code for parking fee management program
#include <iostream>
#include <iomanip>
using namespace std;...
asked 8 minutes ago -
The free energy change for the following reaction at 25 °C, when
[Sn2+] = 1.17 M...
asked 1 hour ago -
An MNE is this kind of industry when competition in one country
is essentially independent of...
asked 3 hours ago -
. For this set of questions, determine what
proportion of a normal distribution is located betweeneach...
asked 4 hours ago -
A college student is employed as a door-to-door newspaper
salesman. Historical data suggests that the student...
asked 4 hours ago -
MATLAB HW 11 problem using Switch Case and Input commands
Write a script file that calculates...
asked 4 hours ago -
Considering gravitational time dilation, calculate the time that
passes in Earth’s surface while 1 hour passes...
asked 5 hours ago -
Minitab Problem: Take the Lake Hume June rainfall data and find
use the processes outlined in...
asked 6 hours ago -
X Company is trying to decide whether to continue using old
equipment to make Product A...
asked 6 hours ago -
IN PYTHON ONLY !! Program 2: Re-work
program #5 (WeeklyHours) from the previous assignment such that...
asked 6 hours ago -
The average length of time between arrivals at a turnpike
toll-booth is 26 seconds. What is...
asked 8 hours ago -
(a) A piston at 6.1 atm contains a gas that occupies a volume of
3.5 L....
asked 9 hours ago