

Homework Answers
The given data is about the number of shoppers present in different lines. Specifically, there are four lines of shoppers. We are to determine if it matters as to which line one is present in. I am presenting the answer as a traditional hypothesis question, you can choose the appropriate answers based on these explicit explanations.
The alternate hypothesis would be that it would matter as to what line one is present in. That is to say that shoppers in each of the lines is not uniform but there are a different number of shoppers in each line.
The null hypothesis would be negation of this and hence would be that the number of shoppers in each of the lines is uniform.
In order to validate the null, we can perform a chi-square test. The significance level is given to be 0.01. There are a total of n = 4 lines. Therefore, the degrees of freedom are df = n - 1 = 4 - 1 = 3.
The observed data is:
| Check-Out Line |
Observed Frequency |
| Line 1 | 82 |
| Line 2 | 102 |
| Line 3 | 69 |
| Line 4 | 115 |
| TOTAL | 368 |
Next we are to determine the expected number of shoppers in each line. This is to be done assuming the null which states that the number of shoppers in each line is uniform. Therefore, the number of shoppers in each line would be 368 / 4 = 92.
| Check-Out Line |
Observed Frequency |
Expected Frequency |
| Line 1 | 82 | 92 |
| Line 2 | 102 | 92 |
| Line 3 | 69 | 92 |
| Line 4 | 115 | 92 |
| TOTAL | 368 | 368 |
Next we calculate the ratio:

| Check-Out Line |
Observed Frequency |
Expected Frequency | |
| Line 1 | 82 | 92 | 1.087 |
| Line 2 | 102 | 92 | 1.087 |
| Line 3 | 69 | 92 | 5.75 |
| Line 4 | 115 | 92 | 5.75 |
| TOTAL | 368 | 368 | 13.674 |
The chi-square statistic is given using the formula:
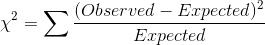
Summing the last column, we get:

Using the aforementioned significance level of 0.01, and df = 3, we get a p-value of p = 0.0034.
Clearly, p = 0.0034 < 0.01. Therefore, the p-value is smaller than the significance level. Therefore, we can reject the null hypothesis and accept the alternate hypothesis.
Therefore we conclude that there is sufficient evidence that the distribution of shoppers is not uniform.
asdfa
Add Answer to:
ASAP HELP!!
You are trying to determine if it matters what check out line you are...
please answer blank boxes and check my answers You are trying to determine if it matters...
 please answer blank boxes and check my answers
You are trying to determine if it matters what check out line you are in at Cost-Co. You randomly observe 368 shoppers as they check-out at Cost-Co. Four check-out lines are open. The results are displayed in the table below. Use a level of significance of a -0.01. a. Complete the rest of the table by filling in the expected frequencies: Frequency of Shoppers in Each Line Check-Out Line Frequency Expected Frequency...
please answer blank boxes and check my answers
You are trying to determine if it matters what check out line you are in at Cost-Co. You randomly observe 368 shoppers as they check-out at Cost-Co. Four check-out lines are open. The results are displayed in the table below. Use a level of significance of a -0.01. a. Complete the rest of the table by filling in the expected frequencies: Frequency of Shoppers in Each Line Check-Out Line Frequency Expected Frequency...
You want to see if a card dealer is favoring one suit over another. You observe...
 You want to see if a card dealer is favoring one suit over another. You observe the dealer pick a card, put it back in the deck, shuffle, and then repeat the process 280 times. The results are displayed in the table below. Use an a = 0.01 significance level. a. Complete the rest of the table by filling in the expected frequencies: Frequencies of Suits Dealt Outcome Frequency Expected Frequency Spades 85 Hearts 61 Diamonds 67 Clubs 67 b....
PLEASE HELP!!! Question 1 You want to see if a card dealer is favoring one suit...
 PLEASE HELP!!!
Question 1 You want to see if a card dealer is favoring one suit over another. You observe the dealer pick a card, put it back in the deck, shuffle, and then repeat the process 308 times. The results are displayed in the table below. Use an -0.01 significance level. a. Complete the rest of the table by filling in the expected frequencies: Frequencies of Suits Dealt Outcome Frequency Expected Frequency Spades 84 Hearts 81 Diamonds 66 Clubs...
PLEASE HELP!!!
Question 1 You want to see if a card dealer is favoring one suit over another. You observe the dealer pick a card, put it back in the deck, shuffle, and then repeat the process 308 times. The results are displayed in the table below. Use an -0.01 significance level. a. Complete the rest of the table by filling in the expected frequencies: Frequencies of Suits Dealt Outcome Frequency Expected Frequency Spades 84 Hearts 81 Diamonds 66 Clubs...
A die is rolled 120 times to see if it is fair. The table below shows...
 A die is rolled 120 times to see if it is fair. The table below shows the frequencies for each of the six possible outcomes. Use a level of significance of a=0.10. a. Complete the rest of the table by filling in the expected frequencies (enter your answers in fraction form) Frequency of Dice Values Outcome Frequency Expected Frequency aw- b. What is the correct statistical test to use? Select an answer c. What are the null and alternative hypotheses?...
Suppose a random sample of 924 athletes from the college are asked what their m...
 Suppose a random sample of 924 athletes from the college are asked what their major is. The table below shows the results of the survey Observed Frequencies of Majors from the Sample Outcome Observed Frequency Math Science 286 Arts & Humanities Business & Economics 247 Other 253 138 The distribution of majors at the college is shown in the second column of the table below. Fill in the expected frequencies (Round to the nearest whole number). Frequencies of Majors at...
help with d,e,f,g,h,i A die is rolled 120 times to see if it is fair. The...
 help with d,e,f,g,h,i
A die is rolled 120 times to see if it is fair. The table below shows the frequencies for each of the six possible outcomes. Use a level of significance of a = 0.05. a. Complete the rest of the table by filling in the expected frequencies (enter your answers in fraction form): Ex Frequency of Dice Values Outcome Frequency Expected Frequency 29 20 2 23 20 3 17 20 4 10 20 5 23 20 С...
help with d,e,f,g,h,i
A die is rolled 120 times to see if it is fair. The table below shows the frequencies for each of the six possible outcomes. Use a level of significance of a = 0.05. a. Complete the rest of the table by filling in the expected frequencies (enter your answers in fraction form): Ex Frequency of Dice Values Outcome Frequency Expected Frequency 29 20 2 23 20 3 17 20 4 10 20 5 23 20 С...
Are phone calls equally likely to occur any day of the week? The day of the...
 Are phone calls equally likely to occur any day of the week? The day of the week for each of 700 randomly selected phone calls was observed. The results are displayed in the table below. Use an a=0.01 significance level. a. Complete the rest of the table by filling in the expected frequencies: Frequencies of Phone Calls for Each Day of the Week Outcome Frequency Expected Frequency Sunday 112 Monday 120 Tuesday 115 Wednesday 87 Thursday 73 Friday 91 Saturday...
Are phone calls equally likely to occur any day of the week? The day of the...
Are phone calls equally likely to occur any day of the week? The day of the week for each of 504 randomly selected phone calls was observed. The results are displayed in the table below. Use an αα = 0.05 significance level. Complete the rest of the table by filling in the expected frequencies: Frequencies of Phone Calls for Each Day of the Week Outcome Frequency Expected Frequency Sunday 56 Monday 52 Tuesday 61 Wednesday 92 Thursday 73 Friday...
Are phone calls equally likely to occur any day of the week? The day of the...
Are phone calls equally likely to occur any day of the week? The day of the week for each of 525 randomly selected phone calls was observed. The results are displayed in the table below. Use an αα = 0.05 significance level. Complete the rest of the table by filling in the expected frequencies: Frequencies of Phone Calls for Each Day of the Week Outcome Frequency Expected Frequency Sunday 80 Monday 73 Tuesday 69 Wednesday 71 Thursday 80 Friday...
 please answer blank boxes and check my answers
You are trying to determine if it matters what check out line you are in at Cost-Co. You randomly observe 368 shoppers as they check-out at Cost-Co. Four check-out lines are open. The results are displayed in the table below. Use a level of significance of a -0.01. a. Complete the rest of the table by filling in the expected frequencies: Frequency of Shoppers in Each Line Check-Out Line Frequency Expected Frequency...
please answer blank boxes and check my answers
You are trying to determine if it matters what check out line you are in at Cost-Co. You randomly observe 368 shoppers as they check-out at Cost-Co. Four check-out lines are open. The results are displayed in the table below. Use a level of significance of a -0.01. a. Complete the rest of the table by filling in the expected frequencies: Frequency of Shoppers in Each Line Check-Out Line Frequency Expected Frequency...
 You want to see if a card dealer is favoring one suit over another. You observe the dealer pick a card, put it back in the deck, shuffle, and then repeat the process 280 times. The results are displayed in the table below. Use an a = 0.01 significance level. a. Complete the rest of the table by filling in the expected frequencies: Frequencies of Suits Dealt Outcome Frequency Expected Frequency Spades 85 Hearts 61 Diamonds 67 Clubs 67 b....
 PLEASE HELP!!!
Question 1 You want to see if a card dealer is favoring one suit over another. You observe the dealer pick a card, put it back in the deck, shuffle, and then repeat the process 308 times. The results are displayed in the table below. Use an -0.01 significance level. a. Complete the rest of the table by filling in the expected frequencies: Frequencies of Suits Dealt Outcome Frequency Expected Frequency Spades 84 Hearts 81 Diamonds 66 Clubs...
PLEASE HELP!!!
Question 1 You want to see if a card dealer is favoring one suit over another. You observe the dealer pick a card, put it back in the deck, shuffle, and then repeat the process 308 times. The results are displayed in the table below. Use an -0.01 significance level. a. Complete the rest of the table by filling in the expected frequencies: Frequencies of Suits Dealt Outcome Frequency Expected Frequency Spades 84 Hearts 81 Diamonds 66 Clubs...
 A die is rolled 120 times to see if it is fair. The table below shows the frequencies for each of the six possible outcomes. Use a level of significance of a=0.10. a. Complete the rest of the table by filling in the expected frequencies (enter your answers in fraction form) Frequency of Dice Values Outcome Frequency Expected Frequency aw- b. What is the correct statistical test to use? Select an answer c. What are the null and alternative hypotheses?...
 Suppose a random sample of 924 athletes from the college are asked what their major is. The table below shows the results of the survey Observed Frequencies of Majors from the Sample Outcome Observed Frequency Math Science 286 Arts & Humanities Business & Economics 247 Other 253 138 The distribution of majors at the college is shown in the second column of the table below. Fill in the expected frequencies (Round to the nearest whole number). Frequencies of Majors at...
 help with d,e,f,g,h,i
A die is rolled 120 times to see if it is fair. The table below shows the frequencies for each of the six possible outcomes. Use a level of significance of a = 0.05. a. Complete the rest of the table by filling in the expected frequencies (enter your answers in fraction form): Ex Frequency of Dice Values Outcome Frequency Expected Frequency 29 20 2 23 20 3 17 20 4 10 20 5 23 20 С...
help with d,e,f,g,h,i
A die is rolled 120 times to see if it is fair. The table below shows the frequencies for each of the six possible outcomes. Use a level of significance of a = 0.05. a. Complete the rest of the table by filling in the expected frequencies (enter your answers in fraction form): Ex Frequency of Dice Values Outcome Frequency Expected Frequency 29 20 2 23 20 3 17 20 4 10 20 5 23 20 С...
 Are phone calls equally likely to occur any day of the week? The day of the week for each of 700 randomly selected phone calls was observed. The results are displayed in the table below. Use an a=0.01 significance level. a. Complete the rest of the table by filling in the expected frequencies: Frequencies of Phone Calls for Each Day of the Week Outcome Frequency Expected Frequency Sunday 112 Monday 120 Tuesday 115 Wednesday 87 Thursday 73 Friday 91 Saturday...
 Are phone calls equally likely to occur any day of the week? The day of the week for each of 700 randomly selected phone calls was observed. The results are displayed in the table below. Use an a=0.01 significance level. a. Complete the rest of the table by filling in the expected frequencies: Frequencies of Phone Calls for Each Day of the Week Outcome Frequency Expected Frequency Sunday 112 Monday 120 Tuesday 115 Wednesday 87 Thursday 73 Friday 91 Saturday...
Most questions answered within 3 hours.
-
Assume that the population of Mexico is 128
million and that the population increases 1.01
percentannually....
asked 16 minutes ago -
Can someone please help me add appropriate descriptive
comments to each line of code in the...
asked 22 minutes ago -
Romeo wishes to throw a bouquet of flowers to Juliet, who is on
a second-story balcony,...
asked 1 hour ago -
Why is QE a controversial monetary policy tool.
A. It may lead to excessive inflation.B. By...
asked 1 hour ago -
Principles of Programming midterm study guide help!
1.)
______ Which of the following would reference the...
asked 1 hour ago -
A finite potential well has depth U0 = 2.78 eV . What is the
penetration distance...
asked 2 hours ago -
1. The bus bars of a power station are in two sections A and B
separated...
asked 2 hours ago -
Fiscal policy is the deliberate manipulation of taxes and
government spending to alter GDP, employment, inflation...
asked 2 hours ago -
evaluating an expression using only one digit and + and - as
operators ....3+5-1+7-5+8
-----------------------
stack...
asked 2 hours ago -
Two concentric current loops lie in the same plane. The smaller
loop has a radius of...
asked 3 hours ago -
1)Which of the following is an
important difference between qualified and nonqualified retirement
plans?
a. Qualified...
asked 3 hours ago -
What's the streaming business's problem on the
horizon?
asked 4 hours ago