

Homework Answers

Add Answer to:
The table provides summary statistics on highway fuel economy of cars manufactured in 2012 (from Exercise...
The table provides summary statistics on highway fuel economy of cars manufactured in 2012 (from Exercise...
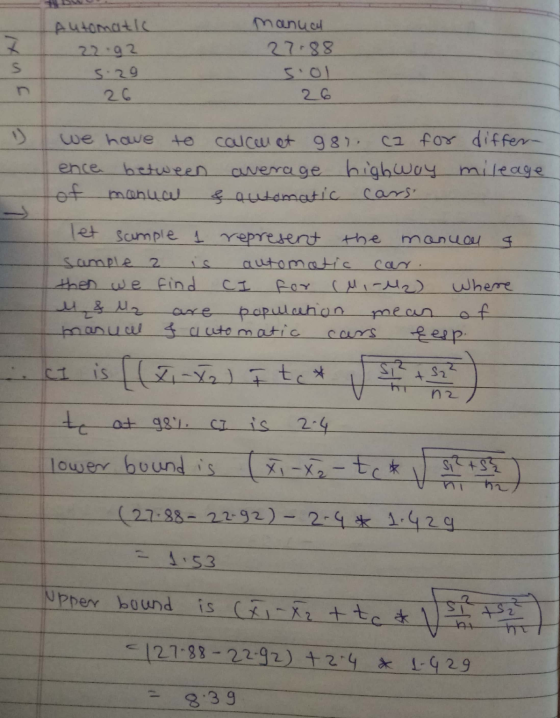
 The table provides summary statistics on highway fuel economy of
cars manufactured in 2012 (from Exercise 5.32). Use these
statistics to calculate a 98% confidence interval for the
difference between average highway mileage of manual and automatic
cars, and interpret this interval in the context of the data.
Hwy MPG, Automatic
Hwy MPG, Manual
Mean
22.92
27.88
SD
5.29
5.01
n
26
26
lower bound: mpg (please round to two decimal
places)
upper bound: mpg (please round to two decimal
places)
Interpret...
The table provides summary statistics on highway fuel economy of
cars manufactured in 2012 (from Exercise 5.32). Use these
statistics to calculate a 98% confidence interval for the
difference between average highway mileage of manual and automatic
cars, and interpret this interval in the context of the data.
Hwy MPG, Automatic
Hwy MPG, Manual
Mean
22.92
27.88
SD
5.29
5.01
n
26
26
lower bound: mpg (please round to two decimal
places)
upper bound: mpg (please round to two decimal
places)
Interpret...
The table provides summary statistics on highway fuel economy of cars manufactured in 2012 (from Exercise...
 The table provides summary statistics on highway fuel economy of cars manufactured in 2012 (from Exercise 5.32). Use these statistics to calculate a 98% confidence interval for the difference between average highway mileage of manual and automatic cars, and interpret this interval in the context of the data. Mean SD Hwy MPG, Automatic 22.92 5.29 26 Hwy MPG, Manual 27.88 5.01 26 n 35- 25 15 automatic manual Hwy MPG lower bound: mpg (please round to two decimal places) upper...
The table provides summary statistics on highway fuel economy of cars manufactured in 2012 (from Exercise...
 The table provides summary statistics on highway fuel economy of cars manufactured in 2012 (from Exercise 5.32). Use these statistics to calculate a 98% confidence interval for the difference between average highway mileage of manual and automatic cars, and interpret this interval in the context of the data. Hwy MPG, Automatic Hwy MPG, Manual Mean 22.92 27.88 SD 5.29 5.01 26 n 26 35 25 IH 15 automatic manual Hwy MPG lower bound: mpg (please round to two decimal places)...
The table provides summary statistics on highway fuel economy of cars manufactured in 2012 (from Exercise...
 The table provides summary statistics on highway fuel economy of
cars manufactured in 2012 (from Exercise 5.32). Use these
statistics to calculate a 98% confidence interval for the
difference between average highway mileage of manual and automatic
cars, and interpret this interval in the context of the data.
Hwy MPG, Automatic
Hwy MPG, Manual
Mean
22.92
27.88
SD
5.29
5.01
n
26
26
lower bound: ______ (please round to two decimal
places)
upper bound: ______ (please round to two decimal...
The table provides summary statistics on highway fuel economy of
cars manufactured in 2012 (from Exercise 5.32). Use these
statistics to calculate a 98% confidence interval for the
difference between average highway mileage of manual and automatic
cars, and interpret this interval in the context of the data.
Hwy MPG, Automatic
Hwy MPG, Manual
Mean
22.92
27.88
SD
5.29
5.01
n
26
26
lower bound: ______ (please round to two decimal
places)
upper bound: ______ (please round to two decimal...
Fach year the US Environmental Protection Agency (EPA) releases fuel economy data on cars manufactured in...
 Fach year the US Environmental Protection Agency (EPA) releases fuel economy data on cars manufactured in that year. Below are summary statistics on fuel efficiency (in miles/gallon) from a random sample of cars with manual transmissions and a random sample of cars with automatic transmissions manufactured in 2012. Assume that conditions for inference are satisfied City MPG Automatic Manual 16.12 19.85 3.58 4.51 Mean SD automatic manual City MPG (a) Compute the standard error (SE) of the difference of the...
In analyzing the city and highway fuel efficiencies of many cars and trucks, the mean difference...
In analyzing the city and highway fuel efficiencies of many cars and trucks, the mean difference in fuel efficiencies for the 642 vehicles was 7.35 mpg with a standard deviation of 2.48 mpg. Find a 95% confidence interval for this difference and interpret it in context. The 95% confidence interval for the difference in fuel efficiencies is left parenthesis nothing comma nothing right parenthesis mpg.
We considered the differences between the reading and writing scores of a random sample of 200...
We considered the differences between the reading and writing scores of a random sample of 200 students who took the High School and Beyond Survey in Exercise 5.21. The mean and standard deviation of the differences are x̄read-write = -0.545 and 8.887 points respectively. (a) Calculate a 95% confidence interval for the average difference between the reading and writing scores of all students. lower bound: points (please round to two decimal places) upper bound: points (please round to two decimal...
The highway fuel economy of a 2016 Lexus RX 350 FWD 6-cylinder 3.5-L automatic 5-speed using...
The highway fuel economy of a 2016 Lexus RX 350 FWD 6-cylinder 3.5-L automatic 5-speed using premium fuel is a normally distributed random variable with a mean of μ = 25.50 mpg and a standard deviation of σ = 2.25 mpg. (a) What is the standard error of X¯ , the mean from a random sample of 25 fill-ups by one driver? (Round your answer to 4 decimal places.) Standard error of X¯ (b) Within what interval would you expect...
PLEASE SHOW THE CALCULATOR TI84 WAY OF DOING THIS. OR SHOW WORK Each year the US...
 PLEASE SHOW THE CALCULATOR TI84 WAY OF DOING THIS. OR SHOW
WORK
Each year the US Environmental Protection Agency (EPA) releases fuel economy data on cars manufactured in that year. Below are summary statistics on fuel efficiency (in miles/gallon) from random samples of cars with manual and automatic transmissions manufactured in 2012. Do these data provide strong evidence of a difference between the average fuel efficiency of cars with manual and automatic transmissions in terms of their average city mileage?...
PLEASE SHOW THE CALCULATOR TI84 WAY OF DOING THIS. OR SHOW
WORK
Each year the US Environmental Protection Agency (EPA) releases fuel economy data on cars manufactured in that year. Below are summary statistics on fuel efficiency (in miles/gallon) from random samples of cars with manual and automatic transmissions manufactured in 2012. Do these data provide strong evidence of a difference between the average fuel efficiency of cars with manual and automatic transmissions in terms of their average city mileage?...
 The table provides summary statistics on highway fuel economy of
cars manufactured in 2012 (from Exercise 5.32). Use these
statistics to calculate a 98% confidence interval for the
difference between average highway mileage of manual and automatic
cars, and interpret this interval in the context of the data.
Hwy MPG, Automatic
Hwy MPG, Manual
Mean
22.92
27.88
SD
5.29
5.01
n
26
26
lower bound: mpg (please round to two decimal
places)
upper bound: mpg (please round to two decimal
places)
Interpret...
The table provides summary statistics on highway fuel economy of
cars manufactured in 2012 (from Exercise 5.32). Use these
statistics to calculate a 98% confidence interval for the
difference between average highway mileage of manual and automatic
cars, and interpret this interval in the context of the data.
Hwy MPG, Automatic
Hwy MPG, Manual
Mean
22.92
27.88
SD
5.29
5.01
n
26
26
lower bound: mpg (please round to two decimal
places)
upper bound: mpg (please round to two decimal
places)
Interpret...
 The table provides summary statistics on highway fuel economy of cars manufactured in 2012 (from Exercise 5.32). Use these statistics to calculate a 98% confidence interval for the difference between average highway mileage of manual and automatic cars, and interpret this interval in the context of the data. Mean SD Hwy MPG, Automatic 22.92 5.29 26 Hwy MPG, Manual 27.88 5.01 26 n 35- 25 15 automatic manual Hwy MPG lower bound: mpg (please round to two decimal places) upper...
 The table provides summary statistics on highway fuel economy of cars manufactured in 2012 (from Exercise 5.32). Use these statistics to calculate a 98% confidence interval for the difference between average highway mileage of manual and automatic cars, and interpret this interval in the context of the data. Hwy MPG, Automatic Hwy MPG, Manual Mean 22.92 27.88 SD 5.29 5.01 26 n 26 35 25 IH 15 automatic manual Hwy MPG lower bound: mpg (please round to two decimal places)...
 The table provides summary statistics on highway fuel economy of
cars manufactured in 2012 (from Exercise 5.32). Use these
statistics to calculate a 98% confidence interval for the
difference between average highway mileage of manual and automatic
cars, and interpret this interval in the context of the data.
Hwy MPG, Automatic
Hwy MPG, Manual
Mean
22.92
27.88
SD
5.29
5.01
n
26
26
lower bound: ______ (please round to two decimal
places)
upper bound: ______ (please round to two decimal...
The table provides summary statistics on highway fuel economy of
cars manufactured in 2012 (from Exercise 5.32). Use these
statistics to calculate a 98% confidence interval for the
difference between average highway mileage of manual and automatic
cars, and interpret this interval in the context of the data.
Hwy MPG, Automatic
Hwy MPG, Manual
Mean
22.92
27.88
SD
5.29
5.01
n
26
26
lower bound: ______ (please round to two decimal
places)
upper bound: ______ (please round to two decimal...
 Fach year the US Environmental Protection Agency (EPA) releases fuel economy data on cars manufactured in that year. Below are summary statistics on fuel efficiency (in miles/gallon) from a random sample of cars with manual transmissions and a random sample of cars with automatic transmissions manufactured in 2012. Assume that conditions for inference are satisfied City MPG Automatic Manual 16.12 19.85 3.58 4.51 Mean SD automatic manual City MPG (a) Compute the standard error (SE) of the difference of the...
 PLEASE SHOW THE CALCULATOR TI84 WAY OF DOING THIS. OR SHOW
WORK
Each year the US Environmental Protection Agency (EPA) releases fuel economy data on cars manufactured in that year. Below are summary statistics on fuel efficiency (in miles/gallon) from random samples of cars with manual and automatic transmissions manufactured in 2012. Do these data provide strong evidence of a difference between the average fuel efficiency of cars with manual and automatic transmissions in terms of their average city mileage?...
PLEASE SHOW THE CALCULATOR TI84 WAY OF DOING THIS. OR SHOW
WORK
Each year the US Environmental Protection Agency (EPA) releases fuel economy data on cars manufactured in that year. Below are summary statistics on fuel efficiency (in miles/gallon) from random samples of cars with manual and automatic transmissions manufactured in 2012. Do these data provide strong evidence of a difference between the average fuel efficiency of cars with manual and automatic transmissions in terms of their average city mileage?...
Most questions answered within 3 hours.
-
At the start of a CD it is spinning at a rate of 525 rpm
(revolutions...
asked 34 seconds from now -
4. Without doing any calculations, predict whether the observed
∆T would increase, decrease or remain the...
asked 1 hour ago -
Based on the range, which of the following sets of scores has
the greatest variability? 3,...
asked 2 hours ago -
Ripples in a pond travel at a velocity of 3 m/s with one peak
passing a...
asked 2 hours ago -
A man stands on the roof of a building of height 13.0 mm and
throws a...
asked 2 hours ago -
The extent to which assets are financed by borrowed funds and
other liabilities is indicated by:...
asked 3 hours ago -
Explain in detail
Germany is the fifth largest economy
explain what goods and services Germany specializes...
asked 3 hours ago -
The density of platinum is 21.45 g/mL. If a cube of platinum
with a mass of...
asked 3 hours ago -
Accounts Receivable
Sales
A/R Posting
Extended Sales Invoice
Packing Slip
Compare invoice to packing slip 2...
asked 3 hours ago -
Michaella, age 23, is a full-time law student and is claimed by
her parents as a...
asked 3 hours ago -
Why are polymers not typically casted into products?
asked 4 hours ago -
When rolling a die 129 times, what is the probability of rolling
a 6 no more...
asked 4 hours ago