
Homework Answers
a)


b)
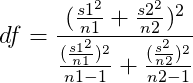

= 47
At 90% confidence level, the critical value is t* = 1.678
The 90% confidence interval is
( )
+/- t* * SE
)
+/- t* * SE
= (16.12 - 19.85) +/- 1.678 * 1.1293
= -3.73 +/- 1.895
= -5.625, -1.835
c) At 95% confidence level, the critical value is t* = 2.012
The 95% confidence interval is
()
+/- t* * SE
= (16.12 - 19.85) +/- 2.012 * 1.1293
= -3.73 +/- 2.272
= -6.002, -1.458
d) We are 90% confidence that the difference between the true population means of fuel efficiency between the cars with automatic transmission and manual transmission lies within the confidence limits between -5.625 and -1.835.
We are 95% confidence that the difference between the true population means of fuel efficiency between the cars with automatic transmission and manual transmission lies within the confidence limits between -6.002 and -1.458.
Add Answer to:
Fach year the US Environmental Protection Agency (EPA) releases fuel economy data on cars manufactured in...
PLEASE SHOW THE CALCULATOR TI84 WAY OF DOING THIS. OR SHOW WORK Each year the US...
 PLEASE SHOW THE CALCULATOR TI84 WAY OF DOING THIS. OR SHOW
WORK
Each year the US Environmental Protection Agency (EPA) releases fuel economy data on cars manufactured in that year. Below are summary statistics on fuel efficiency (in miles/gallon) from random samples of cars with manual and automatic transmissions manufactured in 2012. Do these data provide strong evidence of a difference between the average fuel efficiency of cars with manual and automatic transmissions in terms of their average city mileage?...
PLEASE SHOW THE CALCULATOR TI84 WAY OF DOING THIS. OR SHOW
WORK
Each year the US Environmental Protection Agency (EPA) releases fuel economy data on cars manufactured in that year. Below are summary statistics on fuel efficiency (in miles/gallon) from random samples of cars with manual and automatic transmissions manufactured in 2012. Do these data provide strong evidence of a difference between the average fuel efficiency of cars with manual and automatic transmissions in terms of their average city mileage?...
Based on a problem in Diez, Barr, and Cetinkaya-Rundel (2015). The fuel economy of randomly selected...
 Based on a problem in Diez, Barr, and Cetinkaya-Rundel (2015). The fuel economy of randomly selected cars with automatic and manual transmissions, manufactured in 2012, are compared in the table below in miles per gallon (MPG) for city driving. The data are from the U.S. EPA. Test whether these data provide strong evidence of a difference between the average fuel efficiency of cars with manual and automatic transmissionsin terms of their average city 0.02. mileage. Assume that conditions for inference...
The table provides summary statistics on highway fuel economy of cars manufactured in 2012 (from Exercise...
 The table provides summary statistics on highway fuel economy of
cars manufactured in 2012 (from Exercise 5.32). Use these
statistics to calculate a 98% confidence interval for the
difference between average highway mileage of manual and automatic
cars, and interpret this interval in the context of the data.
Hwy MPG, Automatic
Hwy MPG, Manual
Mean
22.92
27.88
SD
5.29
5.01
n
26
26
lower bound: mpg (please round to two decimal
places)
upper bound: mpg (please round to two decimal
places)
Interpret...
The table provides summary statistics on highway fuel economy of
cars manufactured in 2012 (from Exercise 5.32). Use these
statistics to calculate a 98% confidence interval for the
difference between average highway mileage of manual and automatic
cars, and interpret this interval in the context of the data.
Hwy MPG, Automatic
Hwy MPG, Manual
Mean
22.92
27.88
SD
5.29
5.01
n
26
26
lower bound: mpg (please round to two decimal
places)
upper bound: mpg (please round to two decimal
places)
Interpret...
The table provides summary statistics on highway fuel economy of cars manufactured in 2012 (from Exercise...
 The table provides summary statistics on highway fuel economy of cars manufactured in 2012 (from Exercise 5.32). Use these statistics to calculate a 98% confidence interval for the difference between average highway mileage of manual and automatic cars, and interpret this interval in the context of the data. Mean SD Hwy MPG, Automatic 22.92 5.29 26 Hwy MPG, Manual 27.88 5.01 26 n 35- 25 15 automatic manual Hwy MPG lower bound: mpg (please round to two decimal places) upper...
The table provides summary statistics on highway fuel economy of cars manufactured in 2012 (from Exercise...
 The table provides summary statistics on highway fuel economy of cars manufactured in 2012 (from Exercise 5.32). Use these statistics to calculate a 98% confidence interval for the difference between average highway mileage of manual and automatic cars, and interpret this interval in the context of the data. Hwy MPG, Automatic Hwy MPG, Manual Mean 22.92 27.88 SD 5.29 5.01 26 n 26 35 25 IH 15 automatic manual Hwy MPG lower bound: mpg (please round to two decimal places)...
The table provides summary statistics on highway fuel economy of cars manufactured in 2012 (from Exercise...
 The table provides summary statistics on highway fuel economy of cars manufactured in 2012 (from Exercise 5.32). Use these statistics to calculate a 98% confidence interval for the difference between average highway mileage of manual and automatic cars, and interpret this interval in the context of the data. Mean SD Hwy MPG, Automatic 22.92 5.29 26 Hwy MPG, Manual 27.88 5.01 26 n 35 25 15 automatic manual Hwy MPG upper bound: lower bound: mpg (please round to two decimal...
The table provides summary statistics on highway fuel economy of cars manufactured in 2012 (from Exercise...
 The table provides summary statistics on highway fuel economy of
cars manufactured in 2012 (from Exercise 5.32). Use these
statistics to calculate a 98% confidence interval for the
difference between average highway mileage of manual and automatic
cars, and interpret this interval in the context of the data.
Hwy MPG, Automatic
Hwy MPG, Manual
Mean
22.92
27.88
SD
5.29
5.01
n
26
26
lower bound: ______ (please round to two decimal
places)
upper bound: ______ (please round to two decimal...
The table provides summary statistics on highway fuel economy of
cars manufactured in 2012 (from Exercise 5.32). Use these
statistics to calculate a 98% confidence interval for the
difference between average highway mileage of manual and automatic
cars, and interpret this interval in the context of the data.
Hwy MPG, Automatic
Hwy MPG, Manual
Mean
22.92
27.88
SD
5.29
5.01
n
26
26
lower bound: ______ (please round to two decimal
places)
upper bound: ______ (please round to two decimal...
A travel website would like to estimate the difference between the average rental price of a...
A travel website would like to estimate the difference between the average rental price of a car with automatic transmission versus the average rental price of a car with manual transmission at a certain airport. The table below shows the average one-week rental prices for two random samples, as well as the population standard deviations and sample sizes for each type of car. Complete parts a and b. Sample mean Sample size Population standard deviation Automatic $417.50 55 $24 Manual...
In its Fuel Economy Guide for 2014 model vehicles, the Environmental Protection Agency gives data on 1160 vehicles. The...
In its Fuel Economy Guide for 2014 model vehicles, the Environmental Protection Agency gives data on 1160 vehicles. There are a number of high outliers, mainly hybrid gas-electric vehicles. If we ignore the vehicles identified as outliers, however, the combined city and highway gas mileage of the other 1134 vehicles is approximately Normal with mean 22.2 miles per gallon (mpg) and standard deviation 5.2 mpg. 2014 Volkswagen Beetle with a five-cylinder 2.5L engine and automatic transmission has combined gas mileage...
 PLEASE SHOW THE CALCULATOR TI84 WAY OF DOING THIS. OR SHOW
WORK
Each year the US Environmental Protection Agency (EPA) releases fuel economy data on cars manufactured in that year. Below are summary statistics on fuel efficiency (in miles/gallon) from random samples of cars with manual and automatic transmissions manufactured in 2012. Do these data provide strong evidence of a difference between the average fuel efficiency of cars with manual and automatic transmissions in terms of their average city mileage?...
PLEASE SHOW THE CALCULATOR TI84 WAY OF DOING THIS. OR SHOW
WORK
Each year the US Environmental Protection Agency (EPA) releases fuel economy data on cars manufactured in that year. Below are summary statistics on fuel efficiency (in miles/gallon) from random samples of cars with manual and automatic transmissions manufactured in 2012. Do these data provide strong evidence of a difference between the average fuel efficiency of cars with manual and automatic transmissions in terms of their average city mileage?...
 Based on a problem in Diez, Barr, and Cetinkaya-Rundel (2015). The fuel economy of randomly selected cars with automatic and manual transmissions, manufactured in 2012, are compared in the table below in miles per gallon (MPG) for city driving. The data are from the U.S. EPA. Test whether these data provide strong evidence of a difference between the average fuel efficiency of cars with manual and automatic transmissionsin terms of their average city 0.02. mileage. Assume that conditions for inference...
 The table provides summary statistics on highway fuel economy of
cars manufactured in 2012 (from Exercise 5.32). Use these
statistics to calculate a 98% confidence interval for the
difference between average highway mileage of manual and automatic
cars, and interpret this interval in the context of the data.
Hwy MPG, Automatic
Hwy MPG, Manual
Mean
22.92
27.88
SD
5.29
5.01
n
26
26
lower bound: mpg (please round to two decimal
places)
upper bound: mpg (please round to two decimal
places)
Interpret...
The table provides summary statistics on highway fuel economy of
cars manufactured in 2012 (from Exercise 5.32). Use these
statistics to calculate a 98% confidence interval for the
difference between average highway mileage of manual and automatic
cars, and interpret this interval in the context of the data.
Hwy MPG, Automatic
Hwy MPG, Manual
Mean
22.92
27.88
SD
5.29
5.01
n
26
26
lower bound: mpg (please round to two decimal
places)
upper bound: mpg (please round to two decimal
places)
Interpret...
 The table provides summary statistics on highway fuel economy of cars manufactured in 2012 (from Exercise 5.32). Use these statistics to calculate a 98% confidence interval for the difference between average highway mileage of manual and automatic cars, and interpret this interval in the context of the data. Mean SD Hwy MPG, Automatic 22.92 5.29 26 Hwy MPG, Manual 27.88 5.01 26 n 35- 25 15 automatic manual Hwy MPG lower bound: mpg (please round to two decimal places) upper...
 The table provides summary statistics on highway fuel economy of cars manufactured in 2012 (from Exercise 5.32). Use these statistics to calculate a 98% confidence interval for the difference between average highway mileage of manual and automatic cars, and interpret this interval in the context of the data. Hwy MPG, Automatic Hwy MPG, Manual Mean 22.92 27.88 SD 5.29 5.01 26 n 26 35 25 IH 15 automatic manual Hwy MPG lower bound: mpg (please round to two decimal places)...
 The table provides summary statistics on highway fuel economy of cars manufactured in 2012 (from Exercise 5.32). Use these statistics to calculate a 98% confidence interval for the difference between average highway mileage of manual and automatic cars, and interpret this interval in the context of the data. Mean SD Hwy MPG, Automatic 22.92 5.29 26 Hwy MPG, Manual 27.88 5.01 26 n 35 25 15 automatic manual Hwy MPG upper bound: lower bound: mpg (please round to two decimal...
 The table provides summary statistics on highway fuel economy of
cars manufactured in 2012 (from Exercise 5.32). Use these
statistics to calculate a 98% confidence interval for the
difference between average highway mileage of manual and automatic
cars, and interpret this interval in the context of the data.
Hwy MPG, Automatic
Hwy MPG, Manual
Mean
22.92
27.88
SD
5.29
5.01
n
26
26
lower bound: ______ (please round to two decimal
places)
upper bound: ______ (please round to two decimal...
The table provides summary statistics on highway fuel economy of
cars manufactured in 2012 (from Exercise 5.32). Use these
statistics to calculate a 98% confidence interval for the
difference between average highway mileage of manual and automatic
cars, and interpret this interval in the context of the data.
Hwy MPG, Automatic
Hwy MPG, Manual
Mean
22.92
27.88
SD
5.29
5.01
n
26
26
lower bound: ______ (please round to two decimal
places)
upper bound: ______ (please round to two decimal...
Most questions answered within 3 hours.
-
4. Without doing any calculations, predict whether the observed
∆T would increase, decrease or remain the...
asked 1 hour ago -
Based on the range, which of the following sets of scores has
the greatest variability? 3,...
asked 2 hours ago -
Ripples in a pond travel at a velocity of 3 m/s with one peak
passing a...
asked 2 hours ago -
A man stands on the roof of a building of height 13.0 mm and
throws a...
asked 2 hours ago -
The extent to which assets are financed by borrowed funds and
other liabilities is indicated by:...
asked 3 hours ago -
Explain in detail
Germany is the fifth largest economy
explain what goods and services Germany specializes...
asked 3 hours ago -
The density of platinum is 21.45 g/mL. If a cube of platinum
with a mass of...
asked 3 hours ago -
Accounts Receivable
Sales
A/R Posting
Extended Sales Invoice
Packing Slip
Compare invoice to packing slip 2...
asked 3 hours ago -
Michaella, age 23, is a full-time law student and is claimed by
her parents as a...
asked 3 hours ago -
Why are polymers not typically casted into products?
asked 3 hours ago -
When rolling a die 129 times, what is the probability of rolling
a 6 no more...
asked 4 hours ago -
4. A call option currently sells for $7.75. It has a strike
price of $85 and...
asked 4 hours ago