A subsidy is a benefit given by the government to groups or individuals, usually in the...
- A subsidy is a benefit given by the government to groups or
individuals, usually in the form of cash payment or tax reduction
to encourage production. We can think of a subsidy as a “negative”
tax. Suppose the government gives producers a specific subsidy of
$4 per unit. (35 points)
- Using supply and demand curves, draw a diagram that clearly shows what happens when the specific $4 subsidy is implemented.
- What price do sellers receive and what do the consumers pay?
- On the diagram from part a, label the areas with letters like we have in class. [BE CAREFUL: there are a lot of areas to the label – make sure your drawing is clear] Indicate the change in consumer surplus, producer surplus, government expenditure, and welfare based on these labeled areas; i.e. compare CS, PS, government expenditure, and W before and after the subsidy to find the change. If there is a DWL, label that too.
- Now suppose we know the supply and demand functions:
QD=200-10p and QS=10p.
Find how much the equilibrium price and quantity changes after the subsidy. [Hint: Be careful how you incorporate the per-unit subsidy in the function that changes.]
- Continuing with the above supply and demand functions, find the values for ∆CS, ∆PS, ∆W, the cost of the subsidy to the government, and the DWL.
- Who gains and who loses from the subsidy? Why is there a deadweight loss?
Homework Answers
a.)
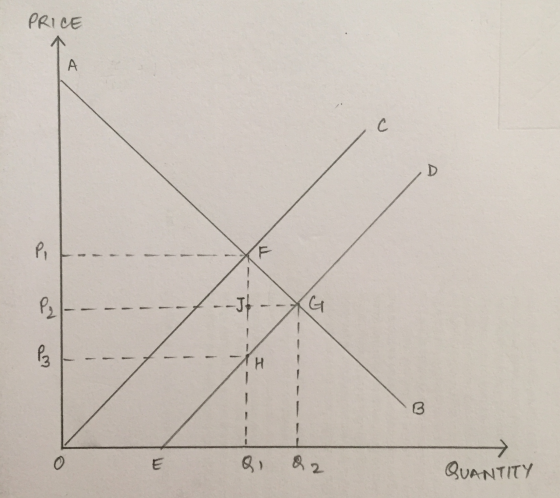
A subsudy will cause the supply curve to shift to the right, from OC to ED in the diagram. This is because the cost to the producers reduces when the subsidy is given to the producers. The diagram is as follows -
b.)
The new price is P2 (falls from P1 to P2) and the new quantity is Q2 (rises from Q1 to Q2)
c.)
Change in consumer surplus: P2P1FG (increases)
Change in producer surplus: P4KFP1 (increases)
Government expenditure: P4KGP2 (increases)
Deaweight loss: FKG
d.)


Now, after the subsidy, we get the supply curve as -


Therefore, price decreases by $2 and quantity increases by 20 units.
Change in consumer surplus: P2P1FG (increases)
Change in producer surplus: P4KFP1 (increases)
Government expenditure: P4KGP2 (increases)
Deaweight loss: FKG
In the above diagram, we get the value of P4 by putting Q=120 in the supply curve before subsidy is added -

Hence, we get -
Change in consumer surplus: 1/2 x (100+120) x 2 = 220
Change in producer surplus: 1/2 x (100+120) x 2 = 220
Government expenditure: 4 x 120 = 480
Deaweight loss: 480 - (220 + 220) = 40
Add Answer to:
A subsidy is a benefit given by the government to groups or
individuals, usually in the...
wanna check final answer I already did it Taxation Suppose now the government decides to intervene the market with...
 wanna check final answer I already did it
Taxation Suppose now the government decides to intervene the market with a tax on producers of $4, determine the price for the consumer, the g. price for the producer, and the quantity produced with the tax Draw a graph (Diagram 4) representing the market for Hallowcen costurmes with a tax on producers of $4. Accurately label and show the h. area for consumers (CS), producer surplus (PS), deadweight loss (DWL), and government...
wanna check final answer I already did it
Taxation Suppose now the government decides to intervene the market with a tax on producers of $4, determine the price for the consumer, the g. price for the producer, and the quantity produced with the tax Draw a graph (Diagram 4) representing the market for Hallowcen costurmes with a tax on producers of $4. Accurately label and show the h. area for consumers (CS), producer surplus (PS), deadweight loss (DWL), and government...
Suppose that the demand curve for wheat is Qd= 400-10p Qs= 10p The government provides producers with a specific subsidy...
Suppose that the demand curve for wheat is Qd= 400-10p Qs= 10p The government provides producers with a specific subsidy of S=$11 per unit. How do the equilibrium price and quantity change? The equilibrium price by $_______ and the equilibrium quantity by $_______ units. (Enter numeric responses using real numbers rounded to two decimal places.) What effect does this tax (subsidy) have on consumer surplus, producer surplus, government revenue, welfare, and deadweight loss? Consumer surplus (increase or decrease) by $...
Text Exercise 5.4 Question Help- Suppose that the demand curve for wheat is Q-100-10p and that...
 Text Exercise 5.4 Question Help- Suppose that the demand curve for wheat is Q-100-10p and that the supply curve is Q 10p What are the effects of a subsidy (negative tax) of s2 per unit paid to producers on the equilbrium, govemment subsidy cost, consumer surplus (CS) producer surplus (PS), welfare (W), and deadweight loss (DWL? With the subsidy, the equilibrium price is $4 and the equilibrium quantity is 60 units (Enter your responses as whole numbers) The cost of...
10 11 1U U JU11CI1115 VIVER 19. Consider the (inverse demand and supply functions, respectively pra by Qa=300-10P (...
 10 11 1U U JU11CI1115 VIVER 19. Consider the (inverse demand and supply functions, respectively pra by Qa=300-10P (or P=30-(1/10)Qd) and Qs=20P (or P=(1/20)Qs). a. Graphically illustrate and label the market, equilibrium, and es welfare (i.e. CS, PS, TS, DWL). b. Numerically calculate the CS, PS, TS, and DWL. noti
Imagine that you have been given a job as an economic advisor to evaluate a certain...
Imagine that you have been given a job as an economic advisor to evaluate a certain competitive US manufacturing industry. Your (accurate) statistical analysis indicates the market is characterized by demand of Qd = 200 - P and supply of Qs = P - 20. Solve for equilibrium price P* and quantity Q*. Depict the supply and demand curves on the usual P, Q diagram. Label all intercepts. Clearly indicate and label the market equilibrium. Graphically indicate the areas of...
1. Market Equilibrium and Incidence of a Subsidy In the market for hazelnuts (Q, measured in...
1. Market Equilibrium and Incidence of a Subsidy In the market for hazelnuts (Q, measured in kilograms), monthly demand is given by Qd(p) = 280,000 – 20,000p, and monthly supply by QS(p) = 5,000p – 20,000, where p is the price of a kg of hazelnuts (in €). Suppose the government introduces a subsidy (s) of €5/kg. a) Find the equilibrium price received by producers before (p*) and after (ps**) the subsidy. [Hint: A subsidy is just a negative tax,...
PART III - QUANTITAYIVE QUESTIONS Answer ALL the following questions. Show any work and calculation. No...
 PART III - QUANTITAYIVE QUESTIONS Answer ALL the following questions. Show any work and calculation. No marks will be allocated for answers without work. 1. Halloween costumes are becoming more popular as we are getting closer to Halloween. The domestic demand and supply for Halloween costumes in Canada are given by the following equations, where is the quantity of Halloween costumes and P is the price of Halloween costumes: P = 80 - (1/500) Q and P - 20 +...
Suppose that the market for green tea can be described by the following demand and supply...
Suppose that the market for green tea can be described by the following demand and supply curves (prices are per kg): Qd = 260 − 5P QS = 8P a) Find the market equilibrium in the absence of taxes. Draw the demand and supply curves, labelling all intercepts and the market equilibrium b) Draw the curves as in the last item, showing clearly the areas representing the consumer surplus (CS) and the producer surplus (PS). Calculate their values and the...
2. Suppose the market demand and supply functions of commodity X (it is a normal good)...
 2. Suppose the market demand and supply functions of commodity X (it is a normal good) are as below: Qp = 120,000 - 20,000 P Qs = 20,000 p ve y em . a) Calculate consumer surplus (CS), producer surplus (PS), and total surplus in part (a) of that question b) Calculate CS, PS, and total surplus in part (c) of that question. How do these values compare to those in part (a) above? Explain the change (that is, explain...
2. Welfare effects of a specific tax. The inverse demand and supply for a product is...
 2. Welfare effects of a specific tax. The inverse demand and supply for a product is given by p = 60 Q, and p Q,respectively. Find the consumer and produce surplus at equilibrium. Now assume a specific tax oft = 2 that is assessed on the sale of each unit sold. Find the changes in CS, PS, and tax revenue а. b. What is the incidence of the tax? с. Determined the Deadweight Loss (DWL) from the tax In this...
 wanna check final answer I already did it
Taxation Suppose now the government decides to intervene the market with a tax on producers of $4, determine the price for the consumer, the g. price for the producer, and the quantity produced with the tax Draw a graph (Diagram 4) representing the market for Hallowcen costurmes with a tax on producers of $4. Accurately label and show the h. area for consumers (CS), producer surplus (PS), deadweight loss (DWL), and government...
wanna check final answer I already did it
Taxation Suppose now the government decides to intervene the market with a tax on producers of $4, determine the price for the consumer, the g. price for the producer, and the quantity produced with the tax Draw a graph (Diagram 4) representing the market for Hallowcen costurmes with a tax on producers of $4. Accurately label and show the h. area for consumers (CS), producer surplus (PS), deadweight loss (DWL), and government...
 Text Exercise 5.4 Question Help- Suppose that the demand curve for wheat is Q-100-10p and that the supply curve is Q 10p What are the effects of a subsidy (negative tax) of s2 per unit paid to producers on the equilbrium, govemment subsidy cost, consumer surplus (CS) producer surplus (PS), welfare (W), and deadweight loss (DWL? With the subsidy, the equilibrium price is $4 and the equilibrium quantity is 60 units (Enter your responses as whole numbers) The cost of...
 10 11 1U U JU11CI1115 VIVER 19. Consider the (inverse demand and supply functions, respectively pra by Qa=300-10P (or P=30-(1/10)Qd) and Qs=20P (or P=(1/20)Qs). a. Graphically illustrate and label the market, equilibrium, and es welfare (i.e. CS, PS, TS, DWL). b. Numerically calculate the CS, PS, TS, and DWL. noti
 PART III - QUANTITAYIVE QUESTIONS Answer ALL the following questions. Show any work and calculation. No marks will be allocated for answers without work. 1. Halloween costumes are becoming more popular as we are getting closer to Halloween. The domestic demand and supply for Halloween costumes in Canada are given by the following equations, where is the quantity of Halloween costumes and P is the price of Halloween costumes: P = 80 - (1/500) Q and P - 20 +...
 2. Suppose the market demand and supply functions of commodity X (it is a normal good) are as below: Qp = 120,000 - 20,000 P Qs = 20,000 p ve y em . a) Calculate consumer surplus (CS), producer surplus (PS), and total surplus in part (a) of that question b) Calculate CS, PS, and total surplus in part (c) of that question. How do these values compare to those in part (a) above? Explain the change (that is, explain...
 2. Welfare effects of a specific tax. The inverse demand and supply for a product is given by p = 60 Q, and p Q,respectively. Find the consumer and produce surplus at equilibrium. Now assume a specific tax oft = 2 that is assessed on the sale of each unit sold. Find the changes in CS, PS, and tax revenue а. b. What is the incidence of the tax? с. Determined the Deadweight Loss (DWL) from the tax In this...
Most questions answered within 3 hours.
-
I need help with my javascript project, I've started on it but I
can't seem to...
asked 51 minutes ago -
Identification of unknown Bacteria by sequencing
rDNA
Having a little trouble understanding the PCR process. This...
asked 1 hour ago -
please answer the four of the questions
4. how are warehouse distribution centers, and cross-
docking...
asked 2 hours ago -
X Company currently makes a part and is considering buying it
from a company that has...
asked 3 hours ago -
The height of a helicopter above the ground is given by h =
2.90t3, where h...
asked 3 hours ago -
Consider the natural join of the relation R(A,B) and S(A,C) on
attribute A. Neither relations have...
asked 3 hours ago -
You are a network planner tasked with developing an IP structure
for the following networks. The...
asked 4 hours ago -
Christmas Express makes wreaths in batch sizes of 30. The
cutting & assembly process takes 4...
asked 4 hours ago -
Suppose a brewery has a filling machine that fills 12-ounce
bottles of beer. It is known...
asked 6 hours ago -
For this problem, carry at least four digits after the decimal
in your calculations. Answers may...
asked 9 hours ago -
Ask a user for three positive integer numbers. Use an input
validation loop to make sure...
asked 9 hours ago -
The most primitive form of data from data analysis perspective
is a. nominal scale b. ordinal...
asked 9 hours ago