
Homework Answers
| applying chi square goodness of fit test: |
| relative | observed | Expected | Chi square | ||
| Category | frequency(p) | Oi | Ei=total*p | R2i=(Oi-Ei)2/Ei | |
| 1 | 0.217 | 148 | 165 | 1.736 | |
| 2 | 0.227 | 169 | 173 | 0.072 | |
| 3 | 0.083 | 67 | 63 | 0.244 | |
| 4 | 0.091 | 51 | 69 | 4.768 | |
| 5 | 0.382 | 325 | 290 | 4.143 | |
| total | 1.00 | 760 | 760 | 10.96 | |
| test statistic X2= | 10.962 | ||||
b_)
goodness of fit test
c_)
Ho:
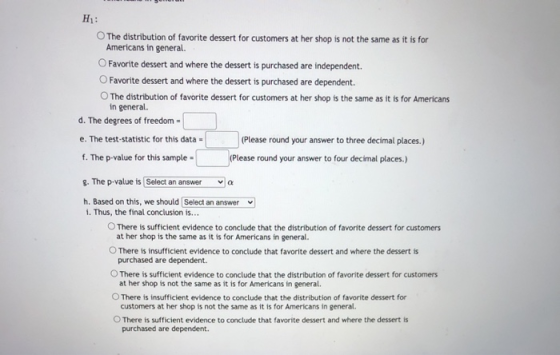
H1:
d)
| degree of freedom =categories-1= | 4 | ||
e)
| test statistic X2= | 10.962 | |
f)
| p value = | 0.0270 | from excel: chidist(10.962,4) |
g)
p value is less than α
h)
reject the null
i)

Add Answer to:
please answer entire question :)
UCLA Health Department did a study that stated that 21.7% of...
A report just came out that stated that 23.6% of all Americans say that vanilla is...
 A report just came out that stated that 23.6% of all Americans say that vanilla is their favorite ice cream, 23.8% say that chocolate is their favorite, 9.7% favor butter pecan, 9% favor strawberry, and the rest have other favorites. An ice cream shop owner thinks that her customers are not like the rest of America. The table below shows the results of 970 of her patrons' ice cream selections. What can be concluded at the a = 0.05 significance...
A report just came out that stated that 21% of all Americans say that vanilla is...
 A report just came out that stated that 21% of all Americans say that vanilla is their favorite ice cream, 232% say that chocolate is their favorite, 8.4% favor butter pecan, 8.7% favor strawberry, and the rest have other favorites. An ice cream shop owner thinks that her customers are not like the rest of America. The table below shows the results of 925 of her patrons' ice cream selections. What can be concluded at the a=0.10 significance level? a....
Suppose a random sample of 924 athletes from the college are asked what their m...
 Suppose a random sample of 924 athletes from the college are asked what their major is. The table below shows the results of the survey Observed Frequencies of Majors from the Sample Outcome Observed Frequency Math Science 286 Arts & Humanities Business & Economics 247 Other 253 138 The distribution of majors at the college is shown in the second column of the table below. Fill in the expected frequencies (Round to the nearest whole number). Frequencies of Majors at...
please answer entire question :) thank you!!! 59 101 45 A breakfast chain that is popular...
 please answer entire question :) thank you!!!
59 101 45 A breakfast chain that is popular in California is hoping to determine if kids (under the age of 18) and adults (18 and older) have different breakfast preferences? The breakfasts ordered by randomly selected kids and adults at a popular breakfast chain in California are shown below. Frequencies of Breakfasts for kids and Adults French Toast Pancakes Waffles Omelets Adults 93 92 86 Kids 73 68 What can be concluded...
please answer entire question :) thank you!!!
59 101 45 A breakfast chain that is popular in California is hoping to determine if kids (under the age of 18) and adults (18 and older) have different breakfast preferences? The breakfasts ordered by randomly selected kids and adults at a popular breakfast chain in California are shown below. Frequencies of Breakfasts for kids and Adults French Toast Pancakes Waffles Omelets Adults 93 92 86 Kids 73 68 What can be concluded...
PLEASE HELP!!! Question 1 You want to see if a card dealer is favoring one suit...
 PLEASE HELP!!!
Question 1 You want to see if a card dealer is favoring one suit over another. You observe the dealer pick a card, put it back in the deck, shuffle, and then repeat the process 308 times. The results are displayed in the table below. Use an -0.01 significance level. a. Complete the rest of the table by filling in the expected frequencies: Frequencies of Suits Dealt Outcome Frequency Expected Frequency Spades 84 Hearts 81 Diamonds 66 Clubs...
PLEASE HELP!!!
Question 1 You want to see if a card dealer is favoring one suit over another. You observe the dealer pick a card, put it back in the deck, shuffle, and then repeat the process 308 times. The results are displayed in the table below. Use an -0.01 significance level. a. Complete the rest of the table by filling in the expected frequencies: Frequencies of Suits Dealt Outcome Frequency Expected Frequency Spades 84 Hearts 81 Diamonds 66 Clubs...
A researcher is interested in investigating whether living situation and pet ownership are dependent. The table...
 A researcher is interested in investigating whether living situation and pet ownership are dependent. The table below shows the results of a survey. Frequencies of Living Situation and Pet Single Family Couple Dog 75 83 Cat 96 87 Various 38 54 33 None What can be concluded at the a-0.05 significance level? a. What is the correct statistical test to use? Independence Homogeneity Goodness-of-Fit Paired t-test b. What are the null and alternative hypotheses? HO: Pet ownership and living situation...
Do men and women select different breakfasts? The breakfasts ordered by randomly selected men and women...
Do men and women select different breakfasts? The breakfasts ordered by randomly selected men and women at a popular breakfast place are shown below. Frequencies of Breakfasts for Men and Women French Toast Pancakes Waffles Omelets Men 93 51 86 71 Women 66 67 100 50 What can be concluded at the α = 0.01 significance level? What is the correct statistical test to use? Goodness-of-Fit Paired t-test Homogeneity Independence What are the null and alternative hypotheses? H0: Breakfast ordered...
your help is appreciated :) 91 40 117 921 A researcher is interested in determining whether...
 your help is appreciated :)
91 40 117 921 A researcher is interested in determining whether the type of computer a person primarily uses and their major are dependent. The table below shows the results of a survey. Frequencies of Computer and Majors Science Business Humanities Google Chromebook 96 86 55 Apple Macbook Microsoft Surface Pro 102 27 What can be concluded at the a-0.05 significance level? a. What is the correct statistical test to use? O Paired t-test O...
your help is appreciated :)
91 40 117 921 A researcher is interested in determining whether the type of computer a person primarily uses and their major are dependent. The table below shows the results of a survey. Frequencies of Computer and Majors Science Business Humanities Google Chromebook 96 86 55 Apple Macbook Microsoft Surface Pro 102 27 What can be concluded at the a-0.05 significance level? a. What is the correct statistical test to use? O Paired t-test O...
A researcher is interested in investigating whether living situation and pet ownership are dependent. The table...
 A researcher is interested in investigating whether living situation and pet ownership are dependent. The table below shows the results of a survey. Frequencies of Living Situation and Pet Single Family Couple Dog 85 84 77 Cat 98 94 67 Various 33 54 52 None 51 56 55 What can be concluded at the a = 0.10 significance level? a. What is the correct statistical test to use? Paired t-test O Independence Goodness-of-Fit Homogeneity b. What are the null and...
 A report just came out that stated that 23.6% of all Americans say that vanilla is their favorite ice cream, 23.8% say that chocolate is their favorite, 9.7% favor butter pecan, 9% favor strawberry, and the rest have other favorites. An ice cream shop owner thinks that her customers are not like the rest of America. The table below shows the results of 970 of her patrons' ice cream selections. What can be concluded at the a = 0.05 significance...
 A report just came out that stated that 21% of all Americans say that vanilla is their favorite ice cream, 232% say that chocolate is their favorite, 8.4% favor butter pecan, 8.7% favor strawberry, and the rest have other favorites. An ice cream shop owner thinks that her customers are not like the rest of America. The table below shows the results of 925 of her patrons' ice cream selections. What can be concluded at the a=0.10 significance level? a....
 Suppose a random sample of 924 athletes from the college are asked what their major is. The table below shows the results of the survey Observed Frequencies of Majors from the Sample Outcome Observed Frequency Math Science 286 Arts & Humanities Business & Economics 247 Other 253 138 The distribution of majors at the college is shown in the second column of the table below. Fill in the expected frequencies (Round to the nearest whole number). Frequencies of Majors at...
 please answer entire question :) thank you!!!
59 101 45 A breakfast chain that is popular in California is hoping to determine if kids (under the age of 18) and adults (18 and older) have different breakfast preferences? The breakfasts ordered by randomly selected kids and adults at a popular breakfast chain in California are shown below. Frequencies of Breakfasts for kids and Adults French Toast Pancakes Waffles Omelets Adults 93 92 86 Kids 73 68 What can be concluded...
please answer entire question :) thank you!!!
59 101 45 A breakfast chain that is popular in California is hoping to determine if kids (under the age of 18) and adults (18 and older) have different breakfast preferences? The breakfasts ordered by randomly selected kids and adults at a popular breakfast chain in California are shown below. Frequencies of Breakfasts for kids and Adults French Toast Pancakes Waffles Omelets Adults 93 92 86 Kids 73 68 What can be concluded...
 PLEASE HELP!!!
Question 1 You want to see if a card dealer is favoring one suit over another. You observe the dealer pick a card, put it back in the deck, shuffle, and then repeat the process 308 times. The results are displayed in the table below. Use an -0.01 significance level. a. Complete the rest of the table by filling in the expected frequencies: Frequencies of Suits Dealt Outcome Frequency Expected Frequency Spades 84 Hearts 81 Diamonds 66 Clubs...
PLEASE HELP!!!
Question 1 You want to see if a card dealer is favoring one suit over another. You observe the dealer pick a card, put it back in the deck, shuffle, and then repeat the process 308 times. The results are displayed in the table below. Use an -0.01 significance level. a. Complete the rest of the table by filling in the expected frequencies: Frequencies of Suits Dealt Outcome Frequency Expected Frequency Spades 84 Hearts 81 Diamonds 66 Clubs...
 A researcher is interested in investigating whether living situation and pet ownership are dependent. The table below shows the results of a survey. Frequencies of Living Situation and Pet Single Family Couple Dog 75 83 Cat 96 87 Various 38 54 33 None What can be concluded at the a-0.05 significance level? a. What is the correct statistical test to use? Independence Homogeneity Goodness-of-Fit Paired t-test b. What are the null and alternative hypotheses? HO: Pet ownership and living situation...
 your help is appreciated :)
91 40 117 921 A researcher is interested in determining whether the type of computer a person primarily uses and their major are dependent. The table below shows the results of a survey. Frequencies of Computer and Majors Science Business Humanities Google Chromebook 96 86 55 Apple Macbook Microsoft Surface Pro 102 27 What can be concluded at the a-0.05 significance level? a. What is the correct statistical test to use? O Paired t-test O...
your help is appreciated :)
91 40 117 921 A researcher is interested in determining whether the type of computer a person primarily uses and their major are dependent. The table below shows the results of a survey. Frequencies of Computer and Majors Science Business Humanities Google Chromebook 96 86 55 Apple Macbook Microsoft Surface Pro 102 27 What can be concluded at the a-0.05 significance level? a. What is the correct statistical test to use? O Paired t-test O...
 A researcher is interested in investigating whether living situation and pet ownership are dependent. The table below shows the results of a survey. Frequencies of Living Situation and Pet Single Family Couple Dog 85 84 77 Cat 98 94 67 Various 33 54 52 None 51 56 55 What can be concluded at the a = 0.10 significance level? a. What is the correct statistical test to use? Paired t-test O Independence Goodness-of-Fit Homogeneity b. What are the null and...
Most questions answered within 3 hours.
-
1) Use the Euclidean algorithm (write in pseudocode) to find the
greatest common divisor of 8...
asked 6 minutes ago -
Based upon the corporate proposal for this week, research three
different data storage options for your...
asked 8 minutes ago -
The equilibrium constant, Kp , for the following reaction is
1.04×10⁻² at 548 K. NH4Cl(s) NH3(g)...
asked 27 minutes ago -
During a recent budgeting discussion, the CFO at "NW Accounting
Services" proposed eliminating the marketing research...
asked 26 minutes ago -
Block B has a mass of 3.80kg and is moving to the left at a
speed...
asked 30 minutes ago -
If n distinct objects are distributed randomly into
n distinct boxes, what is the probability that:...
asked 31 minutes ago -
a) The frequency of light coming out from a laser source is 297
MHz. What is...
asked 53 minutes ago -
LABORATORY EXERCISES:
Using nested for loops, write a java program to print the
pattern as shown...
asked 53 minutes ago -
Assume that the correlation coefficient between achievement test
scores (X) and grade point averages (Y) among...
asked 1 hour ago -
In Chapter 1 titled "So Close and Yet So Different", in "Why
Nations Fail" authors bring...
asked 1 hour ago -
Leadership Philosophy
Write a two-page paper identifying your personal leadership
philosophy based on your new perspective...
asked 59 minutes ago -
Which of these function correctly defines the function g(),
which should return a pointer to a...
asked 1 hour ago