

Homework Answers

..................

....................
.................
| ΣX | ΣY | Σ(x-x̅)² | Σ(y-ȳ)² | Σ(x-x̅)(y-ȳ) | |
| total sum | 300.00 | 215.00 | 480.00 | 1192.00 | 672.00 |
| mean | 60.00 | 43.00 | SSxx | SSyy | SSxy |
Sample size, n = 5
here, x̅ = Σx / n= 60.000
ȳ = Σy/n = 43.000
SSxx = Σ(x-x̅)² = 480.0000
SSxy= Σ(x-x̅)(y-ȳ) = 672.0
estimated slope , ß1 = SSxy/SSxx = 672/480=
1.4000
intercept,ß0 = y̅-ß1* x̄ = 43- (1.4 )*60=
-41.0000
Regression line is, Ŷ= -41.000 +
( 1.400 )*x
..............
Predicted Y at X= 62
is
Ŷ= -41.00000 +
1.40000 *62= 45.8
................
Please let me know in case of any doubt.
Thanks in advance!
Please upvote!
Add Answer to:
please assist
The following data give the percentage of women working in five companies in the...
The following data give the percentage of women working in five companies in the retail and...
 The following data give the percentage of women working in five companies in the retail and trade industry. The percentage of management jobs held by women in each company is also shown. % Working 6745 73 54 61 % Management 51 2364 4632 (a Develop a scatter diagram for these data with the percentage of women working in the company as the independent variable. 20 20 50 . . 50 20 60 50! 60 50 40 60 50 40 Management...
The following data given the percentage of women working in five companies in the retaul and...
 The following data given the percentage of women working in five companies in the retaul and trade industry. The percentage of management jobs held by women in each company is also shown. % Working 67 45 73 54 61 % 49 21 65 47 33 Management a. Develop a scatter diagram for these data with the percentage of women working in the company as the independent variable. b. What does the scatter diagram developed in part (a) indicate about the...
The following data give the percentage of women working in five companies in the retail and...
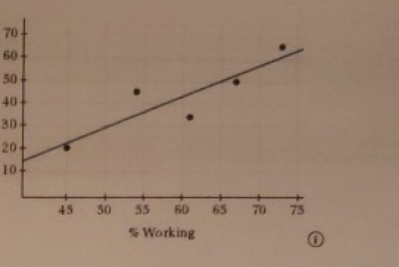
The following data give the percentage of women working in five companies in the retail and trade industry. The percentage of management jobs held by women is also shown. % Working 67 45 73 54 61 % Management 49 21 65 47 33 Compute SST, SSR, and SSE. Compute the coefficient of determination, r2. Comment on the goodness of fit. What is the value of the sample correlation coefficient?
QUESTION 9 The following data give the percentage of women working (x) in five companies in...
 QUESTION 9 The following data give the percentage of women working (x) in five companies in the retail and trade industry. The percentage of management jobs (y) held by women in each company is also shown. Given that SSy- 1120 62 40 68 49 56 1936 256 3600 1764 781 15605 8340 3844 1600 4624 2728 640 4080 058 15б8 1074 16 60 28 3136 Sum 190 Based on question (8), which of the following statement is correct for the...
aren 8, 2012) rer these data In eerose 20, data on x-weght(pounds) and y-price ($) for...
 aren 8, 2012) rer these data In eerose 20, data on x-weght(pounds) and y-price ($) for ten roed-racing bikes provided the estimated regression equation SSE 7,102,922.54 and SST-52,120,800. Use the F test to determine whether the weight for data -28574-1435xくBicycling website, M a bike and the price are related at the 05 level of significance. Click on the webfile logo to reference the WEB Calculate the value of the test stotistic (to 1 decimal) 1.4 The p value is ess...
1.2 The following data indicates the percentage of the class actually working at their maths at...
 1.2 The following data indicates the percentage of the class actually working at their maths at different times one hot Friday afternoon: Time since start of lesson (minutes) Percentage of class working y 5 10 15 20 25 30 35 40 20 30 50 85 75 70 40 10 (a) Evaluate the regression line constants using an extended table (8) (b) Construct a scatterplot and determine whether a likely relationship exists between the time since start of lesson (x) and...
Be able to give traversals of the entire tree: Pre-Order: 45, 25, 15, 10, 20, 35,...
 Be able to give traversals of the entire tree: Pre-Order: 45, 25, 15, 10, 20, 35, 30, 40, 65, 55, 50, 60, 75, 70, 80 (extra 45 removed). In-Order: 10, 15, 20, 25, 30, 35, 40, 45, 50, 55, 60, 65, 70, 75, 80 Post-Order: 10, 20, 15, 30, 40, 35, 25, 50, 60, 55, 70, 80, 75, 65, 45
and y Given are five observations for two variables, 7 20 17 13 29 13 48 52 58 a. Choose the correct scatter diagram f...
 and y Given are five observations for two variables, 7 20 17 13 29 13 48 52 58 a. Choose the correct scatter diagram for these data: B. 60- 60 50- 50 40 30- 30 20- 20 10- 10 40 60 x 50 30 60 v 20 10 4C 50 30 10 D C y y 60- 60 50- 50 40- 40 30- 30 60+ 60+ 50- 50- 40+ 40- 30+ 30- 20+ 20+ 10+ 10 10 20 30 40...
Can you please answers these four questions as aoin as possible please and thank you! Given...
 Can you please answers these four questions as aoin as
possible please and thank you!
Given are five observations for two variables, z and y 5 13 20 18 48 57 11 27 a. Choose the corre rect scatter diagram for these data: A. B. 60+ 60 50 50 40 40 30+ 30 20 20 10 10- 10 20 30 40 50 60 x 10 20 30 40 50 60 57 x y 60 60 50+ 50- 40- 40+ 30-...
Can you please answers these four questions as aoin as
possible please and thank you!
Given are five observations for two variables, z and y 5 13 20 18 48 57 11 27 a. Choose the corre rect scatter diagram for these data: A. B. 60+ 60 50 50 40 40 30+ 30 20 20 10 10- 10 20 30 40 50 60 x 10 20 30 40 50 60 57 x y 60 60 50+ 50- 40- 40+ 30-...
8. Following are the 'Handic spectra for two isomeric hromalkancs, A and B (compon following page) with molecular...
 8. Following are the 'Handic spectra for two isomeric hromalkancs, A and B (compon following page) with molecular formula C.H.Br. Draw their structure. (compound B is on the 1Η COCI (Solvent) www wwwwwwwwwwwwww 95 90 85 80 75 70 wwww 60 55 50 45 65 40 35 30 25 20 15 10 CDCI (Solvent) TMS 95 90 RS 80 75 70 65 60 55 50 45 40 35 30 25 20 15 10 5 0 -5 -10
 The following data give the percentage of women working in five companies in the retail and trade industry. The percentage of management jobs held by women in each company is also shown. % Working 6745 73 54 61 % Management 51 2364 4632 (a Develop a scatter diagram for these data with the percentage of women working in the company as the independent variable. 20 20 50 . . 50 20 60 50! 60 50 40 60 50 40 Management...
 The following data given the percentage of women working in five companies in the retaul and trade industry. The percentage of management jobs held by women in each company is also shown. % Working 67 45 73 54 61 % 49 21 65 47 33 Management a. Develop a scatter diagram for these data with the percentage of women working in the company as the independent variable. b. What does the scatter diagram developed in part (a) indicate about the...
 QUESTION 9 The following data give the percentage of women working (x) in five companies in the retail and trade industry. The percentage of management jobs (y) held by women in each company is also shown. Given that SSy- 1120 62 40 68 49 56 1936 256 3600 1764 781 15605 8340 3844 1600 4624 2728 640 4080 058 15б8 1074 16 60 28 3136 Sum 190 Based on question (8), which of the following statement is correct for the...
 aren 8, 2012) rer these data In eerose 20, data on x-weght(pounds) and y-price ($) for ten roed-racing bikes provided the estimated regression equation SSE 7,102,922.54 and SST-52,120,800. Use the F test to determine whether the weight for data -28574-1435xくBicycling website, M a bike and the price are related at the 05 level of significance. Click on the webfile logo to reference the WEB Calculate the value of the test stotistic (to 1 decimal) 1.4 The p value is ess...
 1.2 The following data indicates the percentage of the class actually working at their maths at different times one hot Friday afternoon: Time since start of lesson (minutes) Percentage of class working y 5 10 15 20 25 30 35 40 20 30 50 85 75 70 40 10 (a) Evaluate the regression line constants using an extended table (8) (b) Construct a scatterplot and determine whether a likely relationship exists between the time since start of lesson (x) and...
 Be able to give traversals of the entire tree: Pre-Order: 45, 25, 15, 10, 20, 35, 30, 40, 65, 55, 50, 60, 75, 70, 80 (extra 45 removed). In-Order: 10, 15, 20, 25, 30, 35, 40, 45, 50, 55, 60, 65, 70, 75, 80 Post-Order: 10, 20, 15, 30, 40, 35, 25, 50, 60, 55, 70, 80, 75, 65, 45
 and y Given are five observations for two variables, 7 20 17 13 29 13 48 52 58 a. Choose the correct scatter diagram for these data: B. 60- 60 50- 50 40 30- 30 20- 20 10- 10 40 60 x 50 30 60 v 20 10 4C 50 30 10 D C y y 60- 60 50- 50 40- 40 30- 30 60+ 60+ 50- 50- 40+ 40- 30+ 30- 20+ 20+ 10+ 10 10 20 30 40...
 Can you please answers these four questions as aoin as
possible please and thank you!
Given are five observations for two variables, z and y 5 13 20 18 48 57 11 27 a. Choose the corre rect scatter diagram for these data: A. B. 60+ 60 50 50 40 40 30+ 30 20 20 10 10- 10 20 30 40 50 60 x 10 20 30 40 50 60 57 x y 60 60 50+ 50- 40- 40+ 30-...
Can you please answers these four questions as aoin as
possible please and thank you!
Given are five observations for two variables, z and y 5 13 20 18 48 57 11 27 a. Choose the corre rect scatter diagram for these data: A. B. 60+ 60 50 50 40 40 30+ 30 20 20 10 10- 10 20 30 40 50 60 x 10 20 30 40 50 60 57 x y 60 60 50+ 50- 40- 40+ 30-...
 8. Following are the 'Handic spectra for two isomeric hromalkancs, A and B (compon following page) with molecular formula C.H.Br. Draw their structure. (compound B is on the 1Η COCI (Solvent) www wwwwwwwwwwwwww 95 90 85 80 75 70 wwww 60 55 50 45 65 40 35 30 25 20 15 10 CDCI (Solvent) TMS 95 90 RS 80 75 70 65 60 55 50 45 40 35 30 25 20 15 10 5 0 -5 -10
Most questions answered within 3 hours.
-
What is the correct unit of the spring constant k?
A- N m
B- J/m
C-...
asked 1 minute ago -
A manufacturing company prepays its insurance coverage for a
three-year period. The premium for the three...
asked 5 minutes ago -
What is the other name for Shortest Job First Preemptive
Algorithm?
What are the 5 different...
asked 18 minutes ago -
24) An outbreak due to exposure of a group of persons to the
same harmful influence...
asked 27 minutes ago -
Show the calculation of (1) the expected grams of alum
(KAl(SO4)2 •12 H2O) formed from the...
asked 30 minutes ago -
*There are two different answers posted. Other students
were asked the same question. Which response is...
asked 1 hour ago -
Data is collected on the relationship between time spent playing
video games and time spent with...
asked 56 minutes ago -
The following data shows the weekly amount spent on pet hair
care products for a sample...
asked 1 hour ago -
In 1986 an electrical power plant in Taylorsville, Georgia,
burned 8,376,726 tons of coal, a national...
asked 37 minutes ago -
If a fertilizer bad is labeled 10-30-10, what is the percent
phosphorus if they actually measured...
asked 40 minutes ago -
Torrance Refinery produces approximately 22.7 Million barrels of
gasoline per year. A California distributor sources its...
asked 46 minutes ago -
Butters and Bebe are having a conversation about money and the
best actresses of all time....
asked 50 minutes ago