60+ 60+ 50- 50- 40+ 40- 30+ 30- 20+ 20+ 10+ 10 10 20 30 40 50 10 20 30 40 50 60 x Select your answer b. What does the scatter diagram developed in part (a) indicate about the relationship between the two variables? linear relationship between There appears to a Select your answer and y c. Try to approximate the relationship between and by drawing a straight line through the data. to provide a linear approximation of the relationship between and y. Select your answer d. Develop the estimated regression equation by computing the values of bo and b using equations: (Enter negative values as negative figure) (-)( ) (-) (to decimals) = 4. e. Use the estimated regression equation to predict the value of y when (to 2 decimals)
Homework Answers
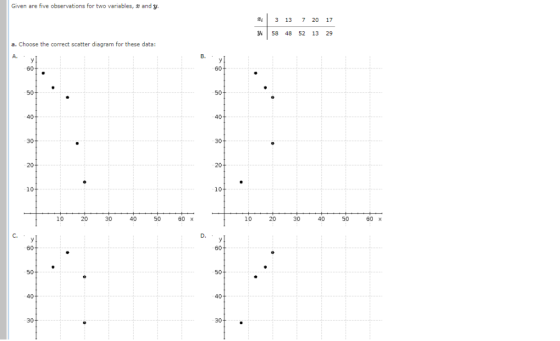
a) Scatter plot: Answer A
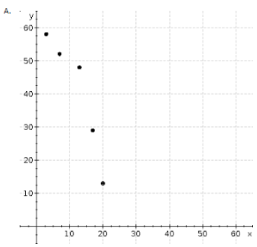
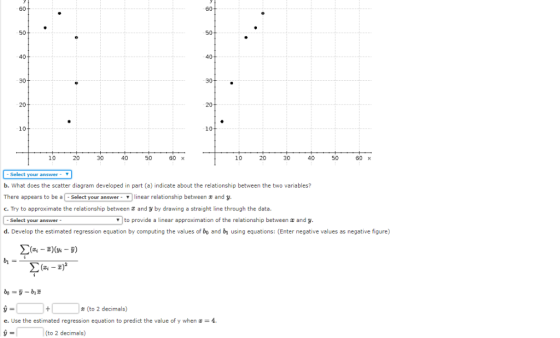
b) there appears to be a Negative linear relationship between x and y.
c) A straight line to provide a linear approximation of the relationship between x and y.
d)
| x | y | (x-x̅)² | (y-ȳ)² | (x-x̅)(y-ȳ) |
| 3 | 58 | 81 | 324 | -162 |
| 13 | 48 | 1 | 64 | 8 |
| 7 | 52 | 25 | 144 | -60 |
| 20 | 13 | 64 | 729 | -216 |
| 17 | 29 | 25 | 121 | -55 |
| ΣX | ΣY | Σ(x-x̅)² | Σ(y-ȳ)² | Σ(x-x̅)(y-ȳ) |
| 60 | 200 | 196 | 1382 | -485 |
x̅ = Ʃx/n = 12
y̅ = Ʃy/n = 40

Regression equation :
ŷ = 69.69 + (-2.47)x
e) Predicted value of y at X = 4
ŷ = 69.6939 + (-2.4745) * 4 = 59.80
Add Answer to:
and y Given are five observations for two variables, 7 20 17 13 29 13 48 52 58 a. Choose the correct scatter diagram f...
* 1 10 7 23 19 4450 4456 10 20 a. Choose the correct scatter diagram...
 * 1 10 7 23 19 4450 4456 10 20 a. Choose the correct scatter diagram for these data: ayl 60+ 10 20 30 40 50 60 10 20 30 40 50 60 Cy! 20. - 10 20 30 40 50 60 10 20 30 40 50 60 b. What does the scatter diagram developed in part (a) indicate about the relationship between the two variables? There appears to be a - Select your answer - linear relationship between 2...
eBook Given are five observations for two variables, and y. 2 1 13 7 18 Yi...
 eBook Given are five observations for two variables, and y. 2 1 13 7 18 Yi 57 46 58 13 16 26 b. What does the scatter diagram developed in part (a) indicate about the relationship between the two variables? There appears to be a negative linear relationship between 2 and y. C. Try to approximate the relationship between 2 and y by drawing a straight line through the data. Only one straight line can be drawn to provide a...
Can you please answers these four questions as aoin as possible please and thank you! Given...
 Can you please answers these four questions as aoin as
possible please and thank you!
Given are five observations for two variables, z and y 5 13 20 18 48 57 11 27 a. Choose the corre rect scatter diagram for these data: A. B. 60+ 60 50 50 40 40 30+ 30 20 20 10 10- 10 20 30 40 50 60 x 10 20 30 40 50 60 57 x y 60 60 50+ 50- 40- 40+ 30-...
Can you please answers these four questions as aoin as
possible please and thank you!
Given are five observations for two variables, z and y 5 13 20 18 48 57 11 27 a. Choose the corre rect scatter diagram for these data: A. B. 60+ 60 50 50 40 40 30+ 30 20 20 10 10- 10 20 30 40 50 60 x 10 20 30 40 50 60 57 x y 60 60 50+ 50- 40- 40+ 30-...
Five observations taken for two variables follow. | 4 yi | 50 6 50 11 40...
 Five observations taken for two variables follow. | 4 yi | 50 6 50 11 40 3 60 16 | 30 a. Which of the following scatter diagrams accurately represents the data set? A. - B. . 60 ----- 50 ------- 운 요 요 10. 20 30 .. ... 19. 20. ..30 .. DY -600 -60- 50 - 40 --------- 30-- - - _20____ 30 ___40 - 20 30 40 - Select your answer - b.What does the scatter diagram...
Given are five observations for two variables, x and y. xi 1 2 3 4 5...
 Given are five observations for two variables, x and
y.
xi
1
2
3
4
5
yi
3
8
4
10
15
(a)
Develop a scatter diagram for these data.
1 2 3 4 5 g 2 N to Go 4 1 2 0 1 3 4 5 6 1 2 3 (b) What does the scatter diagram developed in part (a) indicate about the relationship between the two variables? There appears to be a negative linear relationship between x...
Given are five observations for two variables, x and
y.
xi
1
2
3
4
5
yi
3
8
4
10
15
(a)
Develop a scatter diagram for these data.
1 2 3 4 5 g 2 N to Go 4 1 2 0 1 3 4 5 6 1 2 3 (b) What does the scatter diagram developed in part (a) indicate about the relationship between the two variables? There appears to be a negative linear relationship between x...
6 7 10 4 13 Xi Vi 50 50 40 60 30 (a) Choose the correct...
 6 7 10 4 13 Xi Vi 50 50 40 60 30 (a) Choose the correct scatter diagram with x on the horizontal axis 60 60 50 50 40 40 30 20 10 30 20 10 10 15 10 15 (iv) 60 60 50 50 40 30 20 10 40 30 20 10 10 15 10 15 (iv) 60 60 50 50 40 40 30 30 20 10 20 10 10 15 10 15 -Select your answer- What does the...
aren 8, 2012) rer these data In eerose 20, data on x-weght(pounds) and y-price ($) for...
 aren 8, 2012) rer these data In eerose 20, data on x-weght(pounds) and y-price ($) for ten roed-racing bikes provided the estimated regression equation SSE 7,102,922.54 and SST-52,120,800. Use the F test to determine whether the weight for data -28574-1435xくBicycling website, M a bike and the price are related at the 05 level of significance. Click on the webfile logo to reference the WEB Calculate the value of the test stotistic (to 1 decimal) 1.4 The p value is ess...
Consider the following data for two variables, x and y.
 Consider the following data for two variables, x and y. a. Choose the correct scatter diagram with x and y. The correct scatter diagram is - _______ . Does there appear to be a linear relationship between x and y? Explain. The scatter diagram- Select your answer - some evidence of a possible linear relationship. b. Develop the estimated regression equation relating x and y. Save "predicted" and "residuals" (to 4 decimals). c. Choose the correct scatter diagram or the residuals versus y tor the estimated...
Given are five observations for two variables, x and y. xi 1 2 3 4 5...
Given are five observations for two variables, x and y. xi 1 2 3 4 5 yi 3 7 8 11 14 Which of the following scatter diagrams accurately represents the data? 1. 2. 3. SelectScatter diagram #1Scatter diagram #2Scatter diagram #3Item 1 What does the scatter diagram indicate about the relationship between the two variables? SelectThere appears to be a linear relationship between x and yThere appears to be a nonlinear relationship between x and yItem 2 Try to...
mework eBook Video Use computer software packages, such as Minitab or Excel, to solve this problem....
 mework eBook Video Use computer software packages, such as Minitab or Excel, to solve this problem. Consider the following data for two variables, and y. 3 22 24 26 30 35 40 y 12 21 33 35 40 36 a. Develop an estimated regression equation for the data of the form ý = bo + ba (to 2 decimals, if necessary). Enter negative value as negative number y = -6.77 + 1.23 2 b. Using the results from part (a),...
 * 1 10 7 23 19 4450 4456 10 20 a. Choose the correct scatter diagram for these data: ayl 60+ 10 20 30 40 50 60 10 20 30 40 50 60 Cy! 20. - 10 20 30 40 50 60 10 20 30 40 50 60 b. What does the scatter diagram developed in part (a) indicate about the relationship between the two variables? There appears to be a - Select your answer - linear relationship between 2...
 eBook Given are five observations for two variables, and y. 2 1 13 7 18 Yi 57 46 58 13 16 26 b. What does the scatter diagram developed in part (a) indicate about the relationship between the two variables? There appears to be a negative linear relationship between 2 and y. C. Try to approximate the relationship between 2 and y by drawing a straight line through the data. Only one straight line can be drawn to provide a...
 Can you please answers these four questions as aoin as
possible please and thank you!
Given are five observations for two variables, z and y 5 13 20 18 48 57 11 27 a. Choose the corre rect scatter diagram for these data: A. B. 60+ 60 50 50 40 40 30+ 30 20 20 10 10- 10 20 30 40 50 60 x 10 20 30 40 50 60 57 x y 60 60 50+ 50- 40- 40+ 30-...
Can you please answers these four questions as aoin as
possible please and thank you!
Given are five observations for two variables, z and y 5 13 20 18 48 57 11 27 a. Choose the corre rect scatter diagram for these data: A. B. 60+ 60 50 50 40 40 30+ 30 20 20 10 10- 10 20 30 40 50 60 x 10 20 30 40 50 60 57 x y 60 60 50+ 50- 40- 40+ 30-...
 Five observations taken for two variables follow. | 4 yi | 50 6 50 11 40 3 60 16 | 30 a. Which of the following scatter diagrams accurately represents the data set? A. - B. . 60 ----- 50 ------- 운 요 요 10. 20 30 .. ... 19. 20. ..30 .. DY -600 -60- 50 - 40 --------- 30-- - - _20____ 30 ___40 - 20 30 40 - Select your answer - b.What does the scatter diagram...
 Given are five observations for two variables, x and
y.
xi
1
2
3
4
5
yi
3
8
4
10
15
(a)
Develop a scatter diagram for these data.
1 2 3 4 5 g 2 N to Go 4 1 2 0 1 3 4 5 6 1 2 3 (b) What does the scatter diagram developed in part (a) indicate about the relationship between the two variables? There appears to be a negative linear relationship between x...
Given are five observations for two variables, x and
y.
xi
1
2
3
4
5
yi
3
8
4
10
15
(a)
Develop a scatter diagram for these data.
1 2 3 4 5 g 2 N to Go 4 1 2 0 1 3 4 5 6 1 2 3 (b) What does the scatter diagram developed in part (a) indicate about the relationship between the two variables? There appears to be a negative linear relationship between x...
 6 7 10 4 13 Xi Vi 50 50 40 60 30 (a) Choose the correct scatter diagram with x on the horizontal axis 60 60 50 50 40 40 30 20 10 30 20 10 10 15 10 15 (iv) 60 60 50 50 40 30 20 10 40 30 20 10 10 15 10 15 (iv) 60 60 50 50 40 40 30 30 20 10 20 10 10 15 10 15 -Select your answer- What does the...
 aren 8, 2012) rer these data In eerose 20, data on x-weght(pounds) and y-price ($) for ten roed-racing bikes provided the estimated regression equation SSE 7,102,922.54 and SST-52,120,800. Use the F test to determine whether the weight for data -28574-1435xくBicycling website, M a bike and the price are related at the 05 level of significance. Click on the webfile logo to reference the WEB Calculate the value of the test stotistic (to 1 decimal) 1.4 The p value is ess...
 mework eBook Video Use computer software packages, such as Minitab or Excel, to solve this problem. Consider the following data for two variables, and y. 3 22 24 26 30 35 40 y 12 21 33 35 40 36 a. Develop an estimated regression equation for the data of the form ý = bo + ba (to 2 decimals, if necessary). Enter negative value as negative number y = -6.77 + 1.23 2 b. Using the results from part (a),...
Most questions answered within 3 hours.
-
Calculate the following: ***SHOW ALL WORK!!!! Or
NO CREDIT*** Circle your answers. 8pts
each
In the...
asked 1 hour ago -
Bank Z is currently advertising interest rates on its checking
account. They claim to pay an...
asked 1 hour ago -
List two ways of transformation on the response variable that
can be used to deal with...
asked 2 hours ago -
If a 2000 ohm resistor has a -3.90 mA current going through it.
What is the...
asked 2 hours ago -
Please comment on the sentences.
Some types of jobs require more training than others. Some
companies...
asked 3 hours ago -
The )G01 for the hydrolysis of phosphorarginine
reaction depicted below is –32 kJ mol-1.
Phosphoarginine ...
asked 3 hours ago -
Cross a heterozygous blue-eyed goat with a homozygous brown-eyed
goat. Be sure to indicate which kids...
asked 4 hours ago -
Use the following information to answer the next two
questions.
Please refer to question 9-90. A...
asked 4 hours ago -
A solution containing 0.050 g of an unknown electrolyte in 2.50
g of cyclohexane was found...
asked 4 hours ago -
Question 1
a) Hydraulic conductivity of soils is an important parameter for
the design of engineering...
asked 4 hours ago -
Suppose your credit card balance is
$15,000
The minimum payment is
$313
and the annual percentage...
asked 4 hours ago -
Professor plays basketball and makes 75% of free
throws she shoots. If professor shot 5 free...
asked 4 hours ago