


Homework Answers
a) The accurate scatter-plot for the given data set is plotted as:
C)

b) Based on the scatter-plot developed in part a, we can see that there is a strong relationship between the two variables but there is a negative relationship.
The relationship appears to be negative and strong because the line that is generating due to the dots is an almost straight line and the slope is downwards.
So, there is a strong and negative relationship
c) The following table calculation is used to find the sample covariance as:
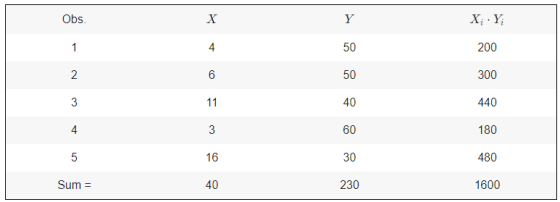
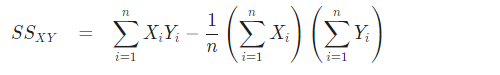
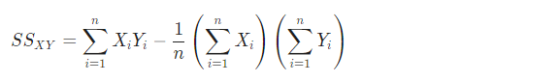
The sum of squares is calculated as:
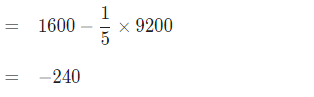
Now the covariance is calculated as:

d) To calculate the correlation coefficient we need to calculate the following table as:
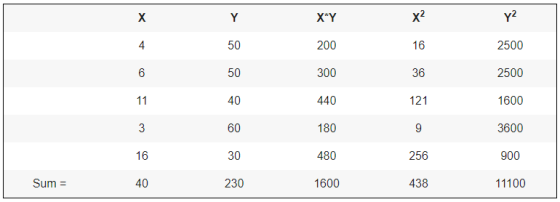
The sum of squares are calculated as:

Based on the data provided the sum of squares are calculated as:

Now the correlation is calculated as:

Based on the sample correlation coefficient we can conclude that:
There is a strong negative linear relationship.
Because the correlation close to 1 or -1 is said to have a strong.
Add Answer to:
Five observations taken for two variables follow. | 4 yi | 50 6 50 11 40...
A department of transportation's study on driving speed and miles per gallon for midsize automobiles resulted in t...
 A department of transportation's study on driving speed and miles per gallon for midsize automobiles resulted in the following data Speed (Miles per our30 50 40 55 30 24 60 25 51 55 Miles per Gallon 28 24 24 23 30 32 21 35 26 25 Compute the sample correlation coefficient (to 2 decimals and enter negative value as negative number) What can you conclude, based on your computation of the sample correlation coefficient? - Select your answer- Select the...
6 7 10 4 13 Xi Vi 50 50 40 60 30 (a) Choose the correct...
 6 7 10 4 13 Xi Vi 50 50 40 60 30 (a) Choose the correct scatter diagram with x on the horizontal axis 60 60 50 50 40 40 30 20 10 30 20 10 10 15 10 15 (iv) 60 60 50 50 40 30 20 10 40 30 20 10 10 15 10 15 (iv) 60 60 50 50 40 40 30 30 20 10 20 10 10 15 10 15 -Select your answer- What does the...
and y Given are five observations for two variables, 7 20 17 13 29 13 48 52 58 a. Choose the correct scatter diagram f...
 and y Given are five observations for two variables, 7 20 17 13 29 13 48 52 58 a. Choose the correct scatter diagram for these data: B. 60- 60 50- 50 40 30- 30 20- 20 10- 10 40 60 x 50 30 60 v 20 10 4C 50 30 10 D C y y 60- 60 50- 50 40- 40 30- 30 60+ 60+ 50- 50- 40+ 40- 30+ 30- 20+ 20+ 10+ 10 10 20 30 40...
Given are five observations for two variables, x and y. 4 8 12 16 18 yi...
 Given are five observations for two variables, x and y. 4 8 12 16 18 yi 58 51 48 14 15 The estimated regression equation for these data is y= 76.77 - 3.41x a. Compute SSE, SST, and SSR (to 2 SSE decimals) (to 2 SST decimals) (to 2 SSR decimals) b. Compute the coefficient of determination r. Comment on the goodness of fit (to 3 decimals) % of the variability in y has been explained by the estimated regression...
show work please 56. Five observations taken for two variables follow. x 6 11 15 21...
 show work please
56. Five observations taken for two variables follow. x 6 11 15 21 27 y, 6 9 6 17 12 a. Develop a scatter diagram for these data. b. What does the scatter diagram indicate about a relationship between x and y? c. Compute and interpret the sample covariance. d. Compute and interpret the sample correlation coefficient
show work please
56. Five observations taken for two variables follow. x 6 11 15 21 27 y, 6 9 6 17 12 a. Develop a scatter diagram for these data. b. What does the scatter diagram indicate about a relationship between x and y? c. Compute and interpret the sample covariance. d. Compute and interpret the sample correlation coefficient
Can you please answers these four questions as aoin as possible please and thank you! Given...
 Can you please answers these four questions as aoin as
possible please and thank you!
Given are five observations for two variables, z and y 5 13 20 18 48 57 11 27 a. Choose the corre rect scatter diagram for these data: A. B. 60+ 60 50 50 40 40 30+ 30 20 20 10 10- 10 20 30 40 50 60 x 10 20 30 40 50 60 57 x y 60 60 50+ 50- 40- 40+ 30-...
Can you please answers these four questions as aoin as
possible please and thank you!
Given are five observations for two variables, z and y 5 13 20 18 48 57 11 27 a. Choose the corre rect scatter diagram for these data: A. B. 60+ 60 50 50 40 40 30+ 30 20 20 10 10- 10 20 30 40 50 60 x 10 20 30 40 50 60 57 x y 60 60 50+ 50- 40- 40+ 30-...
A department of transportation's study on driving speed and miles per gallon for midsize automobiles resulted...
 A department of transportation's study on driving speed and miles per gallon for midsize automobiles resulted in the following data: Speed (Miles per Hour) 30 50 40 55 30 24 60 24 51 56 Miles per Gallon 28 24 24 22 30 33 21 Compute the sample correlation coefficient (to 2 decimals and enter negative value as negative number). 35 26 24 What can you conclude, based on your computation of the sample correlation coefficient? - Select your answer -...
eBook Given are five observations for two variables, and y. 2 1 13 7 18 Yi...
 eBook Given are five observations for two variables, and y. 2 1 13 7 18 Yi 57 46 58 13 16 26 b. What does the scatter diagram developed in part (a) indicate about the relationship between the two variables? There appears to be a negative linear relationship between 2 and y. C. Try to approximate the relationship between 2 and y by drawing a straight line through the data. Only one straight line can be drawn to provide a...
Consider a data set consisting of values for three variables: x, y, and z. Three observations...
 Consider a data set consisting of values for three variables: x, y, and z. Three observations are made on each of the three variables. The following table shows the values of x, y, z, x2, y2, z2, xy, yz, and xz for each observation. Observation x y z x2 y2 z2 xy yz xz 6 6 2 36 36 4 36 12 12 4 3 8 16 9 64 12 24 32 2 6 5 4 36 25 12 30...
4,5 and 6 please 4) Analysis of data from a statistical study showsa lincar relationship in...
 4,5 and 6 please
4) Analysis of data from a statistical study showsa lincar relationship in the data with a correlation coeflicient of -0.524. Which statement best summarines this resul There is a strong positive corelation between the variables There is a strong negative correlation between he variables There is a moderate positive cornelation beween the variables. There is a moderate negative corelation between the variables 4 5) The scatter plot below represents the relationship between the number of peanuts...
4,5 and 6 please
4) Analysis of data from a statistical study showsa lincar relationship in the data with a correlation coeflicient of -0.524. Which statement best summarines this resul There is a strong positive corelation between the variables There is a strong negative correlation between he variables There is a moderate positive cornelation beween the variables. There is a moderate negative corelation between the variables 4 5) The scatter plot below represents the relationship between the number of peanuts...
 A department of transportation's study on driving speed and miles per gallon for midsize automobiles resulted in the following data Speed (Miles per our30 50 40 55 30 24 60 25 51 55 Miles per Gallon 28 24 24 23 30 32 21 35 26 25 Compute the sample correlation coefficient (to 2 decimals and enter negative value as negative number) What can you conclude, based on your computation of the sample correlation coefficient? - Select your answer- Select the...
 6 7 10 4 13 Xi Vi 50 50 40 60 30 (a) Choose the correct scatter diagram with x on the horizontal axis 60 60 50 50 40 40 30 20 10 30 20 10 10 15 10 15 (iv) 60 60 50 50 40 30 20 10 40 30 20 10 10 15 10 15 (iv) 60 60 50 50 40 40 30 30 20 10 20 10 10 15 10 15 -Select your answer- What does the...
 and y Given are five observations for two variables, 7 20 17 13 29 13 48 52 58 a. Choose the correct scatter diagram for these data: B. 60- 60 50- 50 40 30- 30 20- 20 10- 10 40 60 x 50 30 60 v 20 10 4C 50 30 10 D C y y 60- 60 50- 50 40- 40 30- 30 60+ 60+ 50- 50- 40+ 40- 30+ 30- 20+ 20+ 10+ 10 10 20 30 40...
 Given are five observations for two variables, x and y. 4 8 12 16 18 yi 58 51 48 14 15 The estimated regression equation for these data is y= 76.77 - 3.41x a. Compute SSE, SST, and SSR (to 2 SSE decimals) (to 2 SST decimals) (to 2 SSR decimals) b. Compute the coefficient of determination r. Comment on the goodness of fit (to 3 decimals) % of the variability in y has been explained by the estimated regression...
 show work please
56. Five observations taken for two variables follow. x 6 11 15 21 27 y, 6 9 6 17 12 a. Develop a scatter diagram for these data. b. What does the scatter diagram indicate about a relationship between x and y? c. Compute and interpret the sample covariance. d. Compute and interpret the sample correlation coefficient
show work please
56. Five observations taken for two variables follow. x 6 11 15 21 27 y, 6 9 6 17 12 a. Develop a scatter diagram for these data. b. What does the scatter diagram indicate about a relationship between x and y? c. Compute and interpret the sample covariance. d. Compute and interpret the sample correlation coefficient
 Can you please answers these four questions as aoin as
possible please and thank you!
Given are five observations for two variables, z and y 5 13 20 18 48 57 11 27 a. Choose the corre rect scatter diagram for these data: A. B. 60+ 60 50 50 40 40 30+ 30 20 20 10 10- 10 20 30 40 50 60 x 10 20 30 40 50 60 57 x y 60 60 50+ 50- 40- 40+ 30-...
Can you please answers these four questions as aoin as
possible please and thank you!
Given are five observations for two variables, z and y 5 13 20 18 48 57 11 27 a. Choose the corre rect scatter diagram for these data: A. B. 60+ 60 50 50 40 40 30+ 30 20 20 10 10- 10 20 30 40 50 60 x 10 20 30 40 50 60 57 x y 60 60 50+ 50- 40- 40+ 30-...
 A department of transportation's study on driving speed and miles per gallon for midsize automobiles resulted in the following data: Speed (Miles per Hour) 30 50 40 55 30 24 60 24 51 56 Miles per Gallon 28 24 24 22 30 33 21 Compute the sample correlation coefficient (to 2 decimals and enter negative value as negative number). 35 26 24 What can you conclude, based on your computation of the sample correlation coefficient? - Select your answer -...
 eBook Given are five observations for two variables, and y. 2 1 13 7 18 Yi 57 46 58 13 16 26 b. What does the scatter diagram developed in part (a) indicate about the relationship between the two variables? There appears to be a negative linear relationship between 2 and y. C. Try to approximate the relationship between 2 and y by drawing a straight line through the data. Only one straight line can be drawn to provide a...
 Consider a data set consisting of values for three variables: x, y, and z. Three observations are made on each of the three variables. The following table shows the values of x, y, z, x2, y2, z2, xy, yz, and xz for each observation. Observation x y z x2 y2 z2 xy yz xz 6 6 2 36 36 4 36 12 12 4 3 8 16 9 64 12 24 32 2 6 5 4 36 25 12 30...
 4,5 and 6 please
4) Analysis of data from a statistical study showsa lincar relationship in the data with a correlation coeflicient of -0.524. Which statement best summarines this resul There is a strong positive corelation between the variables There is a strong negative correlation between he variables There is a moderate positive cornelation beween the variables. There is a moderate negative corelation between the variables 4 5) The scatter plot below represents the relationship between the number of peanuts...
4,5 and 6 please
4) Analysis of data from a statistical study showsa lincar relationship in the data with a correlation coeflicient of -0.524. Which statement best summarines this resul There is a strong positive corelation between the variables There is a strong negative correlation between he variables There is a moderate positive cornelation beween the variables. There is a moderate negative corelation between the variables 4 5) The scatter plot below represents the relationship between the number of peanuts...
Most questions answered within 3 hours.
-
What kind of materials are found in Leviticus? Give a simple
description of this book. Also...
asked 1 minute ago -
17.1 Energy drink commercials. A study was designed to compare
Red Bull energy drink commercials. Each...
asked 4 minutes ago -
The life that maximizes net present value and shareholder wealth
is known as...
Physical Life
Economic...
asked 28 minutes ago -
You have to write your code in C++ (as a cpp file) and prepare a
docx...
asked 1 hour ago -
Why does the spectrum of bromocresol green changes at different
pHs? What causes the change?
asked 1 hour ago -
Rice Company has a unit selling price of $690, variable costs
per unit of $390, and...
asked 2 hours ago -
The DeVille Company reported pretax accounting
income on its income statement as follows:
2018
$
425,000...
asked 2 hours ago -
Argue for or against the "Three Strikes"laws. Provide a rationale
to support your response.
asked 3 hours ago -
Bargaining Models: what is the "Obsolescing Bargain"?
Bargaining Models: what are the factors that would tend...
asked 4 hours ago -
1. A ball is thrown up into the air.
a) Draw motion diagram and the point-like...
asked 4 hours ago -
1) Because money eliminates the "double coincidence of wants"
problem, the development of money as a...
asked 4 hours ago -
Company AAA produces only one product which other manufacturers
purchase as a component for their final...
asked 7 hours ago