


Homework Answers
Solution:
Here, we have to use chi square test. The null and alternative hypotheses for this test are given as below:
H0: p1 = p2 = p3
H1: At least one of the proportions is different from the others.
We are given level of significance = α = 0.05
Test statistic formula is given as below:
Chi square = ∑[(O – E)^2/E]
Where, O is observed frequencies and E is expected frequencies.
E = row total * column total / Grand total
We are given
Number of rows = r = 2
Number of columns = c = 3
Degrees of freedom = df = (r – 1)*(c – 1) = 1*2 = 2
α = 0.01
Critical value = 9.21034
(by using Chi square table or excel)
Calculation tables for test statistic are given as below:
|
Observed Frequencies |
||||
|
Category |
||||
|
Row variable |
1 |
2 |
3 |
Total |
|
Failures |
74 |
56 |
56 |
186 |
|
Successes |
80 |
81 |
25 |
186 |
|
Total |
154 |
137 |
81 |
372 |
|
Expected Frequencies |
||||
|
Category |
||||
|
Row variable |
1 |
2 |
3 |
Total |
|
Failures |
77 |
68.5 |
40.5 |
186 |
|
Successes |
77 |
68.5 |
40.5 |
186 |
|
Total |
154 |
137 |
81 |
372 |
|
Calculations |
||
|
(O - E) |
||
|
-3 |
-12.5 |
15.5 |
|
3 |
12.5 |
-15.5 |
|
(O - E)^2/E |
||
|
0.116883 |
2.281022 |
5.932099 |
|
0.116883 |
2.281022 |
5.932099 |
Test Statistic = Chi square = ∑[(O – E)^2/E] = 16.66001
χ2 0 = 16.660
P-value = 0.000241
(By using Chi square table or excel)
The P-value is less than .01.
P-value < α = 0.01
So, we reject the null hypothesis
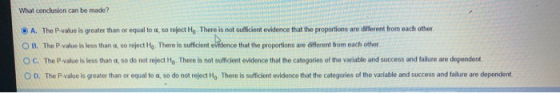
B. The P-value is less than α, so reject H0. There is sufficient evidence that the proportions are different from each other.
Add Answer to:
the
following tabel contains the number of successes and failures for
three categories of a variable....
the following table contains the number of successes and failures for three categories of a variable....
 the
following table contains the number of successes and failures for
three categories of a variable. Test whether the proportions are
equal for each category at the a=.1 level of signifcance.
please help! :)
Failures Successes Category 1 Category 2 Category 3 90 66 38 32 59 40 State the hypotheses. Choose the correct answer below. O A. Ho: P1 P2 P3 H, At least one of the proportions is different from the others. O B. Ho: H = E,...
the
following table contains the number of successes and failures for
three categories of a variable. Test whether the proportions are
equal for each category at the a=.1 level of signifcance.
please help! :)
Failures Successes Category 1 Category 2 Category 3 90 66 38 32 59 40 State the hypotheses. Choose the correct answer below. O A. Ho: P1 P2 P3 H, At least one of the proportions is different from the others. O B. Ho: H = E,...
The following table contains the number of successes and failures for three categories of a variable....
The following table contains the number of successes and failures for three categories of a variable. Test whether the proportions are equal for each category at the α=0.01 level of significance. Category 1 Category Category 3 Failures 69 49 61 Successes 67 74 71 What is the P-value?_________(Round to three decimal places as needed.) please circle the answer
The following table contains the observed number of successes and failures for three categories of a...
 The following table contains the observed number of successes and failures for three categories of a variable: category 1 category2 category3 95 74 Success 81 Failure 48 42 53 Find the expected frequency for the Failure and category2:
The table to the right contains observed values and expected values in parentheses for two categorical...
 The table to the right contains observed values and expected values in parentheses for two categorical variables, and where variable X has three categories and variable Yhas two Categories. Use the table to complete parts (a) and (b) below. M X. X X, 34 42 53 34702 16 22 18 15 3018972173 Y; (4) Compute the value of art statistic x-Round to the decimal places needed) MTest the hypothesis that X and Y are independent the 01 level of sigilance...
The table to the right contains observed values and expected values in parentheses for two categorical...
 The table to the right contains observed values and expected values in parentheses for two categorical variables, X and Y, where variable X has three categories and variable Y has two categories. Use the table to complete parts (a) and (b) below. Y1 X1 X3 32 45 49 (32.72) (47.34) (45.94) 15 23 17 (14.28) 20.66) (20.06) Y2 (a) Compute the value of the chi-square test statistic. x=(Round to three decimal places as needed.) (b) Test the hypothesis that X...
The table to the right contairs observed values and expected values in parentheses for two categorical...
 The table to the right contairs observed values and expected values in parentheses for two categorical variables, X and Y where variable: X has the categories and variable: Y hasta categories. Use the table to complete aarts(a) and (b) helow. 23.05 (42313 45.643 16 1916 114.15 (17.6939.16 2 (a) Compute the value of the chi-square test statistic. Round to three decimal places needed. (b) Test the hypothesis that X and Y are Independent at the a=0.1 level of algnilcance. O...
please provide a detailed answer, thank you! B1 pts Over You are conducting a Goodness of...
 please provide a detailed answer, thank you!
B1 pts Over You are conducting a Goodness of Fit hypothesis test for the claim that the population data values are not distributed as follows: PA = 0.4; P = 0.25; Pc = 0.1; P = 0.25 Give all answers as decimals rounded to 3 places after the decimal point, if necessary. (a) What are the hypotheses for this test? OH:PA = 0.4, PB = 0.25, Pc = 0.1, PD = 0.25 H:...
please provide a detailed answer, thank you!
B1 pts Over You are conducting a Goodness of Fit hypothesis test for the claim that the population data values are not distributed as follows: PA = 0.4; P = 0.25; Pc = 0.1; P = 0.25 Give all answers as decimals rounded to 3 places after the decimal point, if necessary. (a) What are the hypotheses for this test? OH:PA = 0.4, PB = 0.25, Pc = 0.1, PD = 0.25 H:...
14. Use the following information to complete steps (a) through (d) below. A random sample of...
 14. Use the following information to complete steps (a) through (d) below. A random sample of n = 135 individuals results in x1 = 40 successes. An independent sample of n2 = 140 individuals results in X2 = 60 successes. Does this represent sufficient evidence to conclude that p1 <P2 at the a=0.05 level of significance? (a) What type of test should be used? O A. A hypothesis test regarding the difference between two population proportions from independent samples. OB....
please provide a detailed answer, thank you! You are conducting a Goodness of Fit hypothesis test...
 please provide a detailed answer, thank you!
You are conducting a Goodness of Fit hypothesis test for the claim that the population data values are not distributed as follows: PA = 0.1; PB = 0.4; Pc = 0.3; pp = 0.2 Give all answers as decimals rounded to 3 places after the decimal point, if necessary. (a) What are the hypotheses for this test? OH:Pa = 0.1, PB = 0.4, pc = 0.3, pp = 0.2 H: all of these...
please provide a detailed answer, thank you!
You are conducting a Goodness of Fit hypothesis test for the claim that the population data values are not distributed as follows: PA = 0.1; PB = 0.4; Pc = 0.3; pp = 0.2 Give all answers as decimals rounded to 3 places after the decimal point, if necessary. (a) What are the hypotheses for this test? OH:Pa = 0.1, PB = 0.4, pc = 0.3, pp = 0.2 H: all of these...
The table to the right contains observed values and expected values in parentheses for two categorical...
The table to the right contains observed values and expected values in parentheses for two categorical variables, X and Y, where variable X has three categories and variable Y has two categories. Use the table to complete parts (a) and (b) below. Upper X 1 Upper X 2 Upper X 3 Upper Y 1 34 left parenthesis 35.67 right parenthesis 43 left parenthesis 44.77 right parenthesis 51 left parenthesis 47.56 right parenthesis Upper Y 2 17 left parenthesis 15.33 right...
 the
following table contains the number of successes and failures for
three categories of a variable. Test whether the proportions are
equal for each category at the a=.1 level of signifcance.
please help! :)
Failures Successes Category 1 Category 2 Category 3 90 66 38 32 59 40 State the hypotheses. Choose the correct answer below. O A. Ho: P1 P2 P3 H, At least one of the proportions is different from the others. O B. Ho: H = E,...
the
following table contains the number of successes and failures for
three categories of a variable. Test whether the proportions are
equal for each category at the a=.1 level of signifcance.
please help! :)
Failures Successes Category 1 Category 2 Category 3 90 66 38 32 59 40 State the hypotheses. Choose the correct answer below. O A. Ho: P1 P2 P3 H, At least one of the proportions is different from the others. O B. Ho: H = E,...
 The following table contains the observed number of successes and failures for three categories of a variable: category 1 category2 category3 95 74 Success 81 Failure 48 42 53 Find the expected frequency for the Failure and category2:
 The table to the right contains observed values and expected values in parentheses for two categorical variables, and where variable X has three categories and variable Yhas two Categories. Use the table to complete parts (a) and (b) below. M X. X X, 34 42 53 34702 16 22 18 15 3018972173 Y; (4) Compute the value of art statistic x-Round to the decimal places needed) MTest the hypothesis that X and Y are independent the 01 level of sigilance...
 The table to the right contains observed values and expected values in parentheses for two categorical variables, X and Y, where variable X has three categories and variable Y has two categories. Use the table to complete parts (a) and (b) below. Y1 X1 X3 32 45 49 (32.72) (47.34) (45.94) 15 23 17 (14.28) 20.66) (20.06) Y2 (a) Compute the value of the chi-square test statistic. x=(Round to three decimal places as needed.) (b) Test the hypothesis that X...
 The table to the right contairs observed values and expected values in parentheses for two categorical variables, X and Y where variable: X has the categories and variable: Y hasta categories. Use the table to complete aarts(a) and (b) helow. 23.05 (42313 45.643 16 1916 114.15 (17.6939.16 2 (a) Compute the value of the chi-square test statistic. Round to three decimal places needed. (b) Test the hypothesis that X and Y are Independent at the a=0.1 level of algnilcance. O...
 please provide a detailed answer, thank you!
B1 pts Over You are conducting a Goodness of Fit hypothesis test for the claim that the population data values are not distributed as follows: PA = 0.4; P = 0.25; Pc = 0.1; P = 0.25 Give all answers as decimals rounded to 3 places after the decimal point, if necessary. (a) What are the hypotheses for this test? OH:PA = 0.4, PB = 0.25, Pc = 0.1, PD = 0.25 H:...
please provide a detailed answer, thank you!
B1 pts Over You are conducting a Goodness of Fit hypothesis test for the claim that the population data values are not distributed as follows: PA = 0.4; P = 0.25; Pc = 0.1; P = 0.25 Give all answers as decimals rounded to 3 places after the decimal point, if necessary. (a) What are the hypotheses for this test? OH:PA = 0.4, PB = 0.25, Pc = 0.1, PD = 0.25 H:...
 14. Use the following information to complete steps (a) through (d) below. A random sample of n = 135 individuals results in x1 = 40 successes. An independent sample of n2 = 140 individuals results in X2 = 60 successes. Does this represent sufficient evidence to conclude that p1 <P2 at the a=0.05 level of significance? (a) What type of test should be used? O A. A hypothesis test regarding the difference between two population proportions from independent samples. OB....
 please provide a detailed answer, thank you!
You are conducting a Goodness of Fit hypothesis test for the claim that the population data values are not distributed as follows: PA = 0.1; PB = 0.4; Pc = 0.3; pp = 0.2 Give all answers as decimals rounded to 3 places after the decimal point, if necessary. (a) What are the hypotheses for this test? OH:Pa = 0.1, PB = 0.4, pc = 0.3, pp = 0.2 H: all of these...
please provide a detailed answer, thank you!
You are conducting a Goodness of Fit hypothesis test for the claim that the population data values are not distributed as follows: PA = 0.1; PB = 0.4; Pc = 0.3; pp = 0.2 Give all answers as decimals rounded to 3 places after the decimal point, if necessary. (a) What are the hypotheses for this test? OH:Pa = 0.1, PB = 0.4, pc = 0.3, pp = 0.2 H: all of these...
Most questions answered within 3 hours.
-
A researcher in the field of educational psychology obtains a
random sample of 49 fourth grade...
asked 19 minutes ago -
A
liter of liquid soap concentrate sells for 7.2 Yuan in China.
Determine the total volume...
asked 4 minutes ago -
A
person with polycythemia vera ( excess production of red blood
cells) receives radioactive phosphorus-32. Why...
asked 6 minutes ago -
Regression Analysis
Y = Price in $’s for Tracfone service plan
X1 = No. of minutes...
asked 21 minutes ago -
Various computers and operating systems in the past have used
separate instruction and data spaces, allowing...
asked 9 minutes ago -
You have a series of simple polarisers that you can orient as
you choose in succession...
asked 17 minutes ago -
This is a c++ class utilizing class templates
and linked lists. I need to implement the...
asked 23 minutes ago -
How is the Irish banking system different from the rest of
European banks and how does...
asked 24 minutes ago -
Calculate ΔGo for the reaction of ammonia with
oxygen:
4NH3 (g) + 3 O2 (g)...
asked 26 minutes ago -
How do I go from one concentration of cells to another?
In this case, I have...
asked 27 minutes ago -
Old Faithful geyser in Yellowstone Park shoots water hourly to a
height of 49.2 m. With...
asked 41 minutes ago -
What is the difference between Eddy Currents and Induced
Currents? Are they same if yes, how...
asked 43 minutes ago