

Homework Answers

| Applying chi square test of homogeneity |
| Expected | Ei=row total*column total/grand total | Category 1 | Category 2 | Category 3 | Total |
| Failures | 72.8246 | 74.6154 | 46.5600 | 194 | |
| Success | 49.1754 | 50.3846 | 31.4400 | 131 | |
| total | 122 | 125 | 78 | 325 | |
| chi square χ2 | =(Oi-Ei)2/Ei | Category 1 | Category 2 | Category 3 | Total |
| Failures | 4.051 | 0.995 | 1.574 | 6.6193 | |
| Success | 5.999 | 1.473 | 2.331 | 9.8026 | |
| total | 10.0496 | 2.4679 | 3.9043 | 16.4218 | |
| test statistic X2= | 16.422 | ||||
| p value = | 0.000 | from excel: chidist(16.4218,2) | |||

Add Answer to:
the
following table contains the number of successes and failures for
three categories of a variable....
the following tabel contains the number of successes and failures for three categories of a variable....
 the
following tabel contains the number of successes and failures for
three categories of a variable. test whether the proportions are
equal for each category at the a= .01 level of significance
Failures Successes Category 1 Category 2 Category 3 74 56 56 80 81 25 State the hypotheses. Choose the correct answer below. O A. Ho: The categories of the variable and success and failure are dependent. H,: The categories of the variable and success and failure are independent....
the
following tabel contains the number of successes and failures for
three categories of a variable. test whether the proportions are
equal for each category at the a= .01 level of significance
Failures Successes Category 1 Category 2 Category 3 74 56 56 80 81 25 State the hypotheses. Choose the correct answer below. O A. Ho: The categories of the variable and success and failure are dependent. H,: The categories of the variable and success and failure are independent....
The following table contains the number of successes and failures for three categories of a variable....
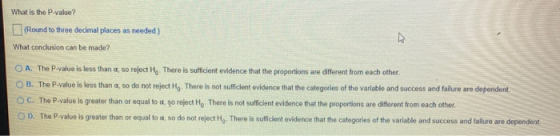
The following table contains the number of successes and failures for three categories of a variable. Test whether the proportions are equal for each category at the α=0.01 level of significance. Category 1 Category Category 3 Failures 69 49 61 Successes 67 74 71 What is the P-value?_________(Round to three decimal places as needed.) please circle the answer
The following table contains the observed number of successes and failures for three categories of a...
 The following table contains the observed number of successes and failures for three categories of a variable: category 1 category2 category3 95 74 Success 81 Failure 48 42 53 Find the expected frequency for the Failure and category2:
The table to the right contains observed values and expected values in parentheses for two categorical...
 The table to the right contains observed values and expected values in parentheses for two categorical variables, X and Y, where variable X has three categories and variable Y has two categories. Use the table to complete parts (a) and (b) below. Y1 X1 X3 32 45 49 (32.72) (47.34) (45.94) 15 23 17 (14.28) 20.66) (20.06) Y2 (a) Compute the value of the chi-square test statistic. x=(Round to three decimal places as needed.) (b) Test the hypothesis that X...
The table to the right contairs observed values and expected values in parentheses for two categorical...
 The table to the right contairs observed values and expected values in parentheses for two categorical variables, X and Y where variable: X has the categories and variable: Y hasta categories. Use the table to complete aarts(a) and (b) helow. 23.05 (42313 45.643 16 1916 114.15 (17.6939.16 2 (a) Compute the value of the chi-square test statistic. Round to three decimal places needed. (b) Test the hypothesis that X and Y are Independent at the a=0.1 level of algnilcance. O...
The table to the right contains observed values and expected values in parentheses for two categorical...
 The table to the right contains observed values and expected values in parentheses for two categorical variables, and where variable X has three categories and variable Yhas two Categories. Use the table to complete parts (a) and (b) below. M X. X X, 34 42 53 34702 16 22 18 15 3018972173 Y; (4) Compute the value of art statistic x-Round to the decimal places needed) MTest the hypothesis that X and Y are independent the 01 level of sigilance...
The table to the right contains observed values and expected values in parentheses for two categorical...
The table to the right contains observed values and expected values in parentheses for two categorical variables, X and Y, where variable X has three categories and variable Y has two categories. Use the table to complete parts (a) and (b) below. Upper X 1 Upper X 2 Upper X 3 Upper Y 1 34 left parenthesis 35.67 right parenthesis 43 left parenthesis 44.77 right parenthesis 51 left parenthesis 47.56 right parenthesis Upper Y 2 17 left parenthesis 15.33 right...
please provide a detailed answer, thank you! B1 pts Over You are conducting a Goodness of...
 please provide a detailed answer, thank you!
B1 pts Over You are conducting a Goodness of Fit hypothesis test for the claim that the population data values are not distributed as follows: PA = 0.4; P = 0.25; Pc = 0.1; P = 0.25 Give all answers as decimals rounded to 3 places after the decimal point, if necessary. (a) What are the hypotheses for this test? OH:PA = 0.4, PB = 0.25, Pc = 0.1, PD = 0.25 H:...
please provide a detailed answer, thank you!
B1 pts Over You are conducting a Goodness of Fit hypothesis test for the claim that the population data values are not distributed as follows: PA = 0.4; P = 0.25; Pc = 0.1; P = 0.25 Give all answers as decimals rounded to 3 places after the decimal point, if necessary. (a) What are the hypotheses for this test? OH:PA = 0.4, PB = 0.25, Pc = 0.1, PD = 0.25 H:...
Most pregnancies are full term, but some are preterm (less than 37 weeks). Of those that...
 Most pregnancies are full term, but some are preterm (less than 37 weeks). Of those that are preterm, they are classified as early (less than 34 weeks) and late (34 to 36 weeks). A report examined those outcomes for one year, broken down by age of the mother. Is there evidence that the outcomes are not independent of age group? Under 20 20 to 29 30 to 39 40 or Over Early Preterm 129 249 163 Late Preterm 275 593...
please provide a detailed answer, thank you! You are conducting a Goodness of Fit hypothesis test...
 please provide a detailed answer, thank you!
You are conducting a Goodness of Fit hypothesis test for the claim that the population data values are not distributed as follows: PA = 0.1; PB = 0.4; Pc = 0.3; pp = 0.2 Give all answers as decimals rounded to 3 places after the decimal point, if necessary. (a) What are the hypotheses for this test? OH:Pa = 0.1, PB = 0.4, pc = 0.3, pp = 0.2 H: all of these...
please provide a detailed answer, thank you!
You are conducting a Goodness of Fit hypothesis test for the claim that the population data values are not distributed as follows: PA = 0.1; PB = 0.4; Pc = 0.3; pp = 0.2 Give all answers as decimals rounded to 3 places after the decimal point, if necessary. (a) What are the hypotheses for this test? OH:Pa = 0.1, PB = 0.4, pc = 0.3, pp = 0.2 H: all of these...
 the
following tabel contains the number of successes and failures for
three categories of a variable. test whether the proportions are
equal for each category at the a= .01 level of significance
Failures Successes Category 1 Category 2 Category 3 74 56 56 80 81 25 State the hypotheses. Choose the correct answer below. O A. Ho: The categories of the variable and success and failure are dependent. H,: The categories of the variable and success and failure are independent....
the
following tabel contains the number of successes and failures for
three categories of a variable. test whether the proportions are
equal for each category at the a= .01 level of significance
Failures Successes Category 1 Category 2 Category 3 74 56 56 80 81 25 State the hypotheses. Choose the correct answer below. O A. Ho: The categories of the variable and success and failure are dependent. H,: The categories of the variable and success and failure are independent....
 The following table contains the observed number of successes and failures for three categories of a variable: category 1 category2 category3 95 74 Success 81 Failure 48 42 53 Find the expected frequency for the Failure and category2:
 The table to the right contains observed values and expected values in parentheses for two categorical variables, X and Y, where variable X has three categories and variable Y has two categories. Use the table to complete parts (a) and (b) below. Y1 X1 X3 32 45 49 (32.72) (47.34) (45.94) 15 23 17 (14.28) 20.66) (20.06) Y2 (a) Compute the value of the chi-square test statistic. x=(Round to three decimal places as needed.) (b) Test the hypothesis that X...
 The table to the right contairs observed values and expected values in parentheses for two categorical variables, X and Y where variable: X has the categories and variable: Y hasta categories. Use the table to complete aarts(a) and (b) helow. 23.05 (42313 45.643 16 1916 114.15 (17.6939.16 2 (a) Compute the value of the chi-square test statistic. Round to three decimal places needed. (b) Test the hypothesis that X and Y are Independent at the a=0.1 level of algnilcance. O...
 The table to the right contains observed values and expected values in parentheses for two categorical variables, and where variable X has three categories and variable Yhas two Categories. Use the table to complete parts (a) and (b) below. M X. X X, 34 42 53 34702 16 22 18 15 3018972173 Y; (4) Compute the value of art statistic x-Round to the decimal places needed) MTest the hypothesis that X and Y are independent the 01 level of sigilance...
 please provide a detailed answer, thank you!
B1 pts Over You are conducting a Goodness of Fit hypothesis test for the claim that the population data values are not distributed as follows: PA = 0.4; P = 0.25; Pc = 0.1; P = 0.25 Give all answers as decimals rounded to 3 places after the decimal point, if necessary. (a) What are the hypotheses for this test? OH:PA = 0.4, PB = 0.25, Pc = 0.1, PD = 0.25 H:...
please provide a detailed answer, thank you!
B1 pts Over You are conducting a Goodness of Fit hypothesis test for the claim that the population data values are not distributed as follows: PA = 0.4; P = 0.25; Pc = 0.1; P = 0.25 Give all answers as decimals rounded to 3 places after the decimal point, if necessary. (a) What are the hypotheses for this test? OH:PA = 0.4, PB = 0.25, Pc = 0.1, PD = 0.25 H:...
 Most pregnancies are full term, but some are preterm (less than 37 weeks). Of those that are preterm, they are classified as early (less than 34 weeks) and late (34 to 36 weeks). A report examined those outcomes for one year, broken down by age of the mother. Is there evidence that the outcomes are not independent of age group? Under 20 20 to 29 30 to 39 40 or Over Early Preterm 129 249 163 Late Preterm 275 593...
 please provide a detailed answer, thank you!
You are conducting a Goodness of Fit hypothesis test for the claim that the population data values are not distributed as follows: PA = 0.1; PB = 0.4; Pc = 0.3; pp = 0.2 Give all answers as decimals rounded to 3 places after the decimal point, if necessary. (a) What are the hypotheses for this test? OH:Pa = 0.1, PB = 0.4, pc = 0.3, pp = 0.2 H: all of these...
please provide a detailed answer, thank you!
You are conducting a Goodness of Fit hypothesis test for the claim that the population data values are not distributed as follows: PA = 0.1; PB = 0.4; Pc = 0.3; pp = 0.2 Give all answers as decimals rounded to 3 places after the decimal point, if necessary. (a) What are the hypotheses for this test? OH:Pa = 0.1, PB = 0.4, pc = 0.3, pp = 0.2 H: all of these...
Most questions answered within 3 hours.
-
1.b. Fiscal policy is said to suffer from ‘crowding out’.
Explain what this means and why...
asked 2 minutes ago -
The equation for the reaction of nitrogen and oxygen to form
nitrogen oxide is written as...
asked 6 minutes ago -
A scientist reproducing some photoelectric effect experiments
shines a light on a metal electrode, but doesn't...
asked 9 minutes ago -
In a study designed to test the effectiveness of magnets for
treating back pain, 35 patients...
asked 29 minutes ago -
Here are summary statistics for randomly selected weights of
newborn girls:
nequals=193,
x overbarxequals=30.5
hg,
sequals=7.3...
asked 18 minutes ago -
Exercise #3:
Create the “MathTest” class. It will have two class variables:
1) a question and...
asked 21 minutes ago -
In epidemiology, how do you calculate the overall incidence of
cure within two groups? What formula...
asked 25 minutes ago -
A 1 liter solution contains 0.357 M ammonium chloride and 0.268
M ammonia. Addition of 0.295...
asked 26 minutes ago -
What are the advantages and disadvantages of using virtual
reality simulations in health care education?
asked 31 minutes ago -
Given input { 66, 28, 43, 29, 44, 69, 19 } and a hash function
h(x)...
asked 52 minutes ago -
A pebble with mass m is thrown straight up with an initial speed
v0 so that...
asked 55 minutes ago -
Let X be a discrete random variable that follows a
binomial distribution with n = 11...
asked 1 hour ago