The average American gets a haircut every 36 days. Is the average larger for college students?...
The average American gets a haircut every 36 days. Is the average larger for college students? The data below shows the results of a survey of 12 college students asking them how many days elapse between haircuts. Assume that the distribution of the population is normal.
39, 32, 33, 38, 33, 38, 37, 31, 42, 47, 42, 45
Copy to clipboard
What can be concluded at the = 0.10 level of significance?
- For this study, we should use Select an answer t-test for a population mean z-test for a population proportion
- The null and alternative hypotheses would be:
H0:H0: ? μ p Select an answer = ≥ ≤ ≠
H1:H1: ? p μ Select an answer < > ≠ =
- The test statistic ? z t = (please show your answer to 3 decimal places.)
- The p-value = (Please show your answer to 3 decimal places.)
- The p-value is ? ≤ > αα
- Based on this, we should Select an answer fail to reject reject accept the null hypothesis.
- Thus, the final conclusion is that ... Select an answer At the 10% significance level, the data suggest there is sufficient evidence that μ higher than 36 At the 10% significance level, the data suggest there is insufficient evidence that μ higher than 36
Homework Answers
From the given sample data : Sample size=n=12
Sample mean=
Sample standard deviation=s=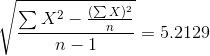
a. Here , the value of the population standard deviation is unknown.
Therefore , use t-distribution .
b. The null and alternative hypothesis is ,

c. The test statistic is ,

d. Now , df=degrees of freedom=n-1=12-1=11
The p-value is ,
p-value= ; The Excel function is , =TDIST(1.384,11,1)
e. Decision : Here , p-value=0.0969 < 0.10 significance level.
Therefore , reject Ho.
Conclusion : At the 10% significance level, the data suggest there is sufficient evidence that μ higher than 36.
Add Answer to:
The average American gets a haircut every 36 days. Is the
average larger for college students?...
The average American gets a haircut every 43 days. Is the average larger for college students?...
The average American gets a haircut every 43 days. Is the average larger for college students? The data below shows the results of a survey of 12 college students asking them how many days elapse between haircuts. Assume that the distribution of the population is normal. 45, 53, 39, 46, 37, 47, 43, 40, 35, 53, 39, 55 What can be concluded at the the α = 0.10 level of significance level of significance? A) For this study, we should...
The average American gets a haircut every 42 days.
The average American gets a haircut every 42 days. Is the average smaller for college students? The data below shows the results of a survey of 11 college students asking them how many days elapse between haircuts. Assume that the distribution of the population is normal. 44, 31, 38, 48, 44, 38, 38, 44, 38, 44, 38 What can be concluded at the α = 0.10 level of significance? a. For this study, we should useb. The null and alternative hypotheses would be: c....
18% of all college students volunteer their time. Is the percentage of college students who are...
18% of all college students volunteer their time. Is the percentage of college students who are volunteers larger for students receiving financial aid? Of the 301 randomly selected students who receive financial aid, 72 of them volunteered their time. What can be concluded at the αα = 0.10 level of significance? For this study, we should use Select an answer t-test for a population mean z-test for a population proportion The null and alternative hypotheses would be: H0:H0: ? p...
The average score for the statistics course is 39%. A professor wants to see if the...
The average score for the statistics course is 39%. A professor wants to see if the average score for students who are given colored pens on the first day of class is larger. The scores for the 16 randomly selected students who were given the colored pens are shown below. Assume that the distribution of the population is normal. 44, 34, 32, 48, 42, 33, 40, 41, 50, 36, 50, 51, 43, 48, 47, 45 Copy to clipboard What can...
The average test score for the statistics course is 81%. A professor wants to see if...
The average test score for the statistics course is 81%. A professor wants to see if the average test score for students who are given colored pens on the first day of class is different. The test scores for the 12 randomly selected students who were given the colored pens are shown below. Assume that the distribution of the population is normal. 82, 59, 64, 78, 66, 73, 79, 61, 65, 54, 85, 58 What can be concluded at the...
19% of all college students volunteer their time. Is the percentage of college students who are...
19% of all college students volunteer their time. Is the percentage of college students who are volunteers larger for students receiving financial aid? Of the 308 randomly selected students who receive financial aid, 65 of them volunteered their time. What can be concluded at the α = 0.01 level of significance? a. For this study, we should use: Z-test for a population proportion or t-test for a population mean? b. The null and alternative hypotheses would be: H 0 :...
Professor Jennings claims that only 35% of the students at Flora College work while attending school....
 Professor Jennings claims that only 35% of the students at Flora
College work while attending school. Dean Renata thinks that the
professor has underestimated the number of students with part-time
or full-time jobs. A random sample of 85 students shows that 40
have jobs. Do the data indicate that more than 35% of the students
have jobs? Use a 5% level of significance.
What are we testing in this problem?
single meansingle proportion
(a) What is the level of significance?...
Professor Jennings claims that only 35% of the students at Flora
College work while attending school. Dean Renata thinks that the
professor has underestimated the number of students with part-time
or full-time jobs. A random sample of 85 students shows that 40
have jobs. Do the data indicate that more than 35% of the students
have jobs? Use a 5% level of significance.
What are we testing in this problem?
single meansingle proportion
(a) What is the level of significance?...
A recent national survey found that high school students watched an average (mean) of 7.6 movies...
A recent national survey found that high school students watched an average (mean) of 7.6 movies per month with a population standard deviation of 0.5. The distribution of number of movies watched per month follows the normal distribution. A random sample of 41 college students revealed that the mean number of movies watched last month was 7.0. At the 0.05 significance level, can we conclude that college students watch fewer movies a month than high school students? State the null...
A recent national survey found that high school students watched an average (mean) of 7.1 movies...
A recent national survey found that high school students watched an average (mean) of 7.1 movies per month with a population standard deviation of 1.0. The distribution of number of movies watched per month follows the normal distribution. A random sample of 41 college students revealed that the mean number of movies watched last month was 6.6. At the 0.05 significance level, can we conclude that college students watch fewer movies a month than high school students? State the null...
A recent national survey found that high school students watched an average (mean) of 7.8 movies...
A recent national survey found that high school students watched an average (mean) of 7.8 movies per month with a population standard deviation of 0.5. The distribution of number of movies watched per month follows the normal distribution. A random sample of 30 college students revealed that the mean number of movies watched last month was 7.3. At the 0.05 significance level, can we conclude that college students watch fewer movies a month than high school students? State the null...
 Professor Jennings claims that only 35% of the students at Flora
College work while attending school. Dean Renata thinks that the
professor has underestimated the number of students with part-time
or full-time jobs. A random sample of 85 students shows that 40
have jobs. Do the data indicate that more than 35% of the students
have jobs? Use a 5% level of significance.
What are we testing in this problem?
single meansingle proportion
(a) What is the level of significance?...
Professor Jennings claims that only 35% of the students at Flora
College work while attending school. Dean Renata thinks that the
professor has underestimated the number of students with part-time
or full-time jobs. A random sample of 85 students shows that 40
have jobs. Do the data indicate that more than 35% of the students
have jobs? Use a 5% level of significance.
What are we testing in this problem?
single meansingle proportion
(a) What is the level of significance?...
Most questions answered within 3 hours.
-
A 0.035 mol sample of a weak acid, HA, is dissolved in 437 mL of
water...
asked 13 seconds from now -
a sample of Ar gas has a volume of 6.30 L with an unknown
pressure. the...
asked 28 seconds ago -
The
serum cholesterol levels of a population of kids follow a normal
distribution with mean 155...
asked 20 minutes ago -
han discusses the racist practice of badlands, a bar
in the Castro
district of San Francisco,...
asked 32 minutes ago -
A sample of final exam scores is normally distributed with a
mean equal to 25 and...
asked 35 minutes ago -
An investor shorts 100 shares of a stock when the share price is
$50 and closes...
asked 39 minutes ago -
LLOP corporation just paid 4$ dividend per share, you expect the
dividend to grow 8% for...
asked 48 minutes ago -
if we subtract 1000 from 0001 is there overflow? (binary)
asked 57 minutes ago -
Hello, I need help with the function below, The language I am
using is Ocaml
open...
asked 58 minutes ago -
Explain how the presence of glucose represses the gal structural
genes?
asked 1 hour ago -
For the reaction CaI2+2AgNO3⟶2AgI+Ca(NO3)2 how many grams of
silver iodide, AgI, are produced from 56.5 g...
asked 1 hour ago -
Write an equation for hydrolysis via acid catalysis.
Using ethyl acetate, ethyl benzoate, ethyl formate or...
asked 1 hour ago