

 (a) Is there a difference
in the measurement of the muzzle velocity between device A and
device B at the α = 0.01 level of significance? Note: A normal
probability plot and boxplot of the data indicate that the
differences are approximately normally distributed with no
outliers. Let di = Ai − Bi.
(a) Is there a difference
in the measurement of the muzzle velocity between device A and
device B at the α = 0.01 level of significance? Note: A normal
probability plot and boxplot of the data indicate that the
differences are approximately normally distributed with no
outliers. Let di = Ai − Bi.
(i) Identify the null and alternative hypotheses.
(ii) Determine the test statistic for this hypothesis test (t0 = ?). Round to two decimal places as needed.
(iii) Calculate avg(d) and sd. Round to six decimal places as needed.
(iv) Find the P-value (P = ?). Round to six decimal places as needed.
(b) Identify the lower and upper bounds for the 99% confidence interval. Round to six decimal places as needed.
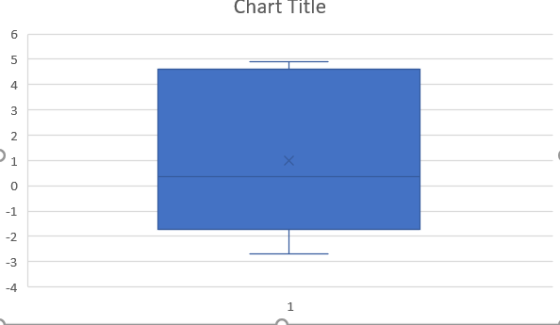
(c) Draw a boxplot of the differenced data. Does this visual evidence support the results obtained in part (a)?
Homework Answers
| SAMPLE 1 | SAMPLE 2 | difference , Di =sample1-sample2 | (Di - Dbar)² |
| 790.4 | 791 | -0.6 | 2.560 |
| 792.9 | 788.4 | 4.5 | 12.250 |
| 794.1 | 795.5 | -1.4 | 5.760 |
| 792.9 | 788 | 4.9 | 15.210 |
| 794.9 | 797.6 | -2.7 | 13.690 |
| 792.8 | 791.5 | 1.3 | 0.090 |
| sample 1 | sample 2 | Di | (Di - Dbar)² | |
| sum = | 4758 | 4752.00 | 6.000 | 49.560 |
Ho : µd= 0
Ha : µd ╪ 0
Level of Significance , α =
0.01
sample size , n = 6
mean of sample 1, x̅1= 793.000
mean of sample 2, x̅2= 792.000
mean of difference , D̅ =ΣDi / n =
1.0000
std dev of difference , Sd = √ [ (Di-Dbar)²/(n-1) =
3.148333
std error , SE = Sd / √n = 3.1483 /
√ 6 = 1.2853
t-statistic = (D̅ - µd)/SE = ( 1
- 0 ) / 1.2853
= 0.78
Degree of freedom, DF= n - 1 =
5
t-critical value , t* = ±
4.0321 [excel function: =t.inv.2t(α,df) ]
p-value = 0.471746 [excel
function: =t.dist.2t(t-stat,df) ]
Decision: p-value>α , Do not reject null
hypothesis
...............
sample size , n = 6
Degree of freedom, DF= n - 1 =
5 and α = 0.01
t-critical value = t α/2,df =
4.0321 [excel function: =t.inv.2t(α/2,df) ]
std dev of difference , Sd = √ [ (Di-Dbar)²/(n-1) =
3.1483
std error , SE = Sd / √n = 3.1483 /
√ 6 = 1.2853
margin of error, E = t*SE = 4.0321
* 1.2853 = 5.1825
mean of difference , D̅ =
1.000
confidence interval is
Interval Lower Limit= D̅ - E = 1.000
- 5.1825 = -4.182520
Interval Upper Limit= D̅ + E = 1.000
+ 5.1825 =
6.182520
Please let me know in case of any doubt.
Thanks in advance!
Please upvote!
Add Answer to:
(a) Is there a difference
in the measurement of the muzzle velocity between device A and...
(a) Does the evidence suggest that community college transfer students take longer to attain a bachelor's...
 (a) Does the evidence suggest that community
college transfer students take longer to attain a bachelor's
degree? Use an α = 0.05 level of significance. Perform a hypothesis
test. Determine the null and alternative hypotheses.
(b) Determine the test statistic (t =
?) and the P-value (P = ?). Round to two decimal
places as needed.
(c) Construct a 90% confidence interval for
(μcommunity college − μno transfer) to
approximate the mean additional time it takes to complete a
bachelor's...
(a) Does the evidence suggest that community
college transfer students take longer to attain a bachelor's
degree? Use an α = 0.05 level of significance. Perform a hypothesis
test. Determine the null and alternative hypotheses.
(b) Determine the test statistic (t =
?) and the P-value (P = ?). Round to two decimal
places as needed.
(c) Construct a 90% confidence interval for
(μcommunity college − μno transfer) to
approximate the mean additional time it takes to complete a
bachelor's...
t-distribution Table -Distribution Area in Right Tail 0.025 0.02 df 0.25 0.20 0.15 0.10 0.05 0.01...
 t-distribution Table -Distribution Area in Right Tail 0.025 0.02 df 0.25 0.20 0.15 0.10 0.05 0.01 0.005 0.0025 0.001 0.0005 3 6 1.000 1.3761.963 0.816 1.061 1.386 0.765 0.978 1.250 0.741 0.941 1.190 0.727 0.9201.156 0.718 0.906 1.134 0.7110.8961.119 0.706 0.889 1.108 0.703 0.883 1.100 0.700 0.879 1.093 0.697 0.876 1.088 0.695 0.873 1.083 0.694 0.870 1.079 0.692 0.868 1.076 0.691 0.866 1.074 0.690 0.865 1.071 0.689 0.863 1.069 0.688 0.862 1.067 0.688 0.861 1.066 3.078 1.886 1.638 1.533 1.476...
t-Distribution Area in Right Tail .
 t-Distribution Area in Right Tail
Degrees of Freedom 0.25 0.2
0.15 0.10 0.05
0.025 0.02 0.01
0.005 0.0025 0.001 0.0005
1 1.000 1.376 1.963
3.078 6.314 12.706
15.894 31.821 63.657
127.321 318.309 636.619
2 0.816 1.061 1.386
1.886 2.920 4.303
4.849 6.965 9.925
14.089 22.327 31.599
3 0.765 0.978 1.250
1.638 2.353 3.182
3.482 4.541 5.841
7.453 10.215 12.924
4 0.741 0.941 ...
t-Distribution Area in Right Tail
Degrees of Freedom 0.25 0.2
0.15 0.10 0.05
0.025 0.02 0.01
0.005 0.0025 0.001 0.0005
1 1.000 1.376 1.963
3.078 6.314 12.706
15.894 31.821 63.657
127.321 318.309 636.619
2 0.816 1.061 1.386
1.886 2.920 4.303
4.849 6.965 9.925
14.089 22.327 31.599
3 0.765 0.978 1.250
1.638 2.353 3.182
3.482 4.541 5.841
7.453 10.215 12.924
4 0.741 0.941 ...
9.2.17 Question Help A simple random sample of size nis drawn from a population that is...
 9.2.17 Question Help A simple random sample of size nis drawn from a population that is normally distributed. The sample mean, X, is found to be 106, and the sample standard deviations, is found to be 10. (a) Construct a 96% confidence interval about if the sample size, n, is 17 (b) Construct a 96% confidence interval about if the sample size, n, is 22 (c) Construct a 98% confidence interval about if the sample size, n, is 17 id...
why is thr p value 0.001 if the value falls off of the table and the...
 why
is thr p value 0.001 if the value falls off of the table and the
greatest number is 3.965 so shouldnt jt be .0005?
1. Hutchinson-Gilford progeria syndrome is a rare genetic condition that produces rapid aging in children. In individuals with the syndrome, cardiovascular disease in a common cause of death in the teenage years. A clinical study examined the effect of treatment with the drug lonafarnib and measured the pulse wave velocity (PWV), an important component of...
why
is thr p value 0.001 if the value falls off of the table and the
greatest number is 3.965 so shouldnt jt be .0005?
1. Hutchinson-Gilford progeria syndrome is a rare genetic condition that produces rapid aging in children. In individuals with the syndrome, cardiovascular disease in a common cause of death in the teenage years. A clinical study examined the effect of treatment with the drug lonafarnib and measured the pulse wave velocity (PWV), an important component of...
T Distribution Table The U.S. Dairy Industry wants to estimate the mean yearly milk consumption. A...
 T Distribution Table
The U.S. Dairy Industry wants to estimate the mean yearly milk consumption. A sample of 25 people reveals the mean yearly consumption to be 82 gallons with a standard deviation of 24 gallons. Assume that the population distribution is normal. (Use Distribution Table.) a-1. What is the value of the population mean? 82 24 Unknown a-2. What is the best estimate of this value? Estimate population mean c. For a 90% confidence interval, what is the value...
T Distribution Table
The U.S. Dairy Industry wants to estimate the mean yearly milk consumption. A sample of 25 people reveals the mean yearly consumption to be 82 gallons with a standard deviation of 24 gallons. Assume that the population distribution is normal. (Use Distribution Table.) a-1. What is the value of the population mean? 82 24 Unknown a-2. What is the best estimate of this value? Estimate population mean c. For a 90% confidence interval, what is the value...
Full data set Uncarpeted A researcher wanted to determine if carpeted or uncarpeted rooms contain...
 Full data set Uncarpeted A researcher wanted to determine if carpeted or uncarpeted rooms contain more bacteria. The table shows the results for the number of bacteria per cubic foot for both types of rooms. A normal probability plot and boxplot indicate that the data are approximately normally distributed with no outliers. Do carpeted rooms have more bacteria than uncarpeted rooms at the α 0.01 level of significance? 1 Click the icon to view the Student t-distribution table 13. Carpeted...
Suppose a huge internet-based lighting company receives a shipment of several thousand boxes of light bulbs...
 Suppose a huge internet-based lighting company receives a shipment of several thousand boxes of light bulbs every Tuesday. Inspectors return the merchandise to the manufacturer if the proportion of damaged light bulbs is more than 0.06 (6%). Rather than inspect all of the packages, 100 boxes are randomly sampled. As long as at least 10 damaged and 10 undamaged light bulbs are found, a one-sample z-test is run with a significance level of 0.01 to see if the proportion of...
The data shown below represent the age (in weeks) at which babies first crawl, based on...
 The data shown below represent the age (in weeks) at which babies first crawl, based on a survey of 12 mothers. Complete parts (a) through (c) below. 52 30 44 350 47 37 56 26 39 35 30 62 Click here to view the table of crical correlation coefficient values for normal probability clots. Click here to view.cage 1 of the standard normal distribution table. Click here to view page 20the standard roma distribution Click here to view the table...
I ONLY NEED HELP WITH PART OF PART "B" I've figured out the test statistic is -1.73 and the degr...
 I ONLY NEED HELP WITH PART OF PART "B"
I've figured out the test statistic is -1.73 and the degrees of
freedom are 5. However, I'm having a hard time finding the P value
via the chart (which I'm required to learn how to do).I think the
chart immediately bellow this is the one used to find the p-value.
However, I know at least one (or more) of the charts bellow is
what's used. Please let me know which chart...
I ONLY NEED HELP WITH PART OF PART "B"
I've figured out the test statistic is -1.73 and the degrees of
freedom are 5. However, I'm having a hard time finding the P value
via the chart (which I'm required to learn how to do).I think the
chart immediately bellow this is the one used to find the p-value.
However, I know at least one (or more) of the charts bellow is
what's used. Please let me know which chart...
 (a) Does the evidence suggest that community
college transfer students take longer to attain a bachelor's
degree? Use an α = 0.05 level of significance. Perform a hypothesis
test. Determine the null and alternative hypotheses.
(b) Determine the test statistic (t =
?) and the P-value (P = ?). Round to two decimal
places as needed.
(c) Construct a 90% confidence interval for
(μcommunity college − μno transfer) to
approximate the mean additional time it takes to complete a
bachelor's...
(a) Does the evidence suggest that community
college transfer students take longer to attain a bachelor's
degree? Use an α = 0.05 level of significance. Perform a hypothesis
test. Determine the null and alternative hypotheses.
(b) Determine the test statistic (t =
?) and the P-value (P = ?). Round to two decimal
places as needed.
(c) Construct a 90% confidence interval for
(μcommunity college − μno transfer) to
approximate the mean additional time it takes to complete a
bachelor's...
 t-distribution Table -Distribution Area in Right Tail 0.025 0.02 df 0.25 0.20 0.15 0.10 0.05 0.01 0.005 0.0025 0.001 0.0005 3 6 1.000 1.3761.963 0.816 1.061 1.386 0.765 0.978 1.250 0.741 0.941 1.190 0.727 0.9201.156 0.718 0.906 1.134 0.7110.8961.119 0.706 0.889 1.108 0.703 0.883 1.100 0.700 0.879 1.093 0.697 0.876 1.088 0.695 0.873 1.083 0.694 0.870 1.079 0.692 0.868 1.076 0.691 0.866 1.074 0.690 0.865 1.071 0.689 0.863 1.069 0.688 0.862 1.067 0.688 0.861 1.066 3.078 1.886 1.638 1.533 1.476...
 t-Distribution Area in Right Tail
Degrees of Freedom 0.25 0.2
0.15 0.10 0.05
0.025 0.02 0.01
0.005 0.0025 0.001 0.0005
1 1.000 1.376 1.963
3.078 6.314 12.706
15.894 31.821 63.657
127.321 318.309 636.619
2 0.816 1.061 1.386
1.886 2.920 4.303
4.849 6.965 9.925
14.089 22.327 31.599
3 0.765 0.978 1.250
1.638 2.353 3.182
3.482 4.541 5.841
7.453 10.215 12.924
4 0.741 0.941 ...
t-Distribution Area in Right Tail
Degrees of Freedom 0.25 0.2
0.15 0.10 0.05
0.025 0.02 0.01
0.005 0.0025 0.001 0.0005
1 1.000 1.376 1.963
3.078 6.314 12.706
15.894 31.821 63.657
127.321 318.309 636.619
2 0.816 1.061 1.386
1.886 2.920 4.303
4.849 6.965 9.925
14.089 22.327 31.599
3 0.765 0.978 1.250
1.638 2.353 3.182
3.482 4.541 5.841
7.453 10.215 12.924
4 0.741 0.941 ...
 9.2.17 Question Help A simple random sample of size nis drawn from a population that is normally distributed. The sample mean, X, is found to be 106, and the sample standard deviations, is found to be 10. (a) Construct a 96% confidence interval about if the sample size, n, is 17 (b) Construct a 96% confidence interval about if the sample size, n, is 22 (c) Construct a 98% confidence interval about if the sample size, n, is 17 id...
 why
is thr p value 0.001 if the value falls off of the table and the
greatest number is 3.965 so shouldnt jt be .0005?
1. Hutchinson-Gilford progeria syndrome is a rare genetic condition that produces rapid aging in children. In individuals with the syndrome, cardiovascular disease in a common cause of death in the teenage years. A clinical study examined the effect of treatment with the drug lonafarnib and measured the pulse wave velocity (PWV), an important component of...
why
is thr p value 0.001 if the value falls off of the table and the
greatest number is 3.965 so shouldnt jt be .0005?
1. Hutchinson-Gilford progeria syndrome is a rare genetic condition that produces rapid aging in children. In individuals with the syndrome, cardiovascular disease in a common cause of death in the teenage years. A clinical study examined the effect of treatment with the drug lonafarnib and measured the pulse wave velocity (PWV), an important component of...
 T Distribution Table
The U.S. Dairy Industry wants to estimate the mean yearly milk consumption. A sample of 25 people reveals the mean yearly consumption to be 82 gallons with a standard deviation of 24 gallons. Assume that the population distribution is normal. (Use Distribution Table.) a-1. What is the value of the population mean? 82 24 Unknown a-2. What is the best estimate of this value? Estimate population mean c. For a 90% confidence interval, what is the value...
T Distribution Table
The U.S. Dairy Industry wants to estimate the mean yearly milk consumption. A sample of 25 people reveals the mean yearly consumption to be 82 gallons with a standard deviation of 24 gallons. Assume that the population distribution is normal. (Use Distribution Table.) a-1. What is the value of the population mean? 82 24 Unknown a-2. What is the best estimate of this value? Estimate population mean c. For a 90% confidence interval, what is the value...
 Full data set Uncarpeted A researcher wanted to determine if carpeted or uncarpeted rooms contain more bacteria. The table shows the results for the number of bacteria per cubic foot for both types of rooms. A normal probability plot and boxplot indicate that the data are approximately normally distributed with no outliers. Do carpeted rooms have more bacteria than uncarpeted rooms at the α 0.01 level of significance? 1 Click the icon to view the Student t-distribution table 13. Carpeted...
 Suppose a huge internet-based lighting company receives a shipment of several thousand boxes of light bulbs every Tuesday. Inspectors return the merchandise to the manufacturer if the proportion of damaged light bulbs is more than 0.06 (6%). Rather than inspect all of the packages, 100 boxes are randomly sampled. As long as at least 10 damaged and 10 undamaged light bulbs are found, a one-sample z-test is run with a significance level of 0.01 to see if the proportion of...
 The data shown below represent the age (in weeks) at which babies first crawl, based on a survey of 12 mothers. Complete parts (a) through (c) below. 52 30 44 350 47 37 56 26 39 35 30 62 Click here to view the table of crical correlation coefficient values for normal probability clots. Click here to view.cage 1 of the standard normal distribution table. Click here to view page 20the standard roma distribution Click here to view the table...
 I ONLY NEED HELP WITH PART OF PART "B"
I've figured out the test statistic is -1.73 and the degrees of
freedom are 5. However, I'm having a hard time finding the P value
via the chart (which I'm required to learn how to do).I think the
chart immediately bellow this is the one used to find the p-value.
However, I know at least one (or more) of the charts bellow is
what's used. Please let me know which chart...
I ONLY NEED HELP WITH PART OF PART "B"
I've figured out the test statistic is -1.73 and the degrees of
freedom are 5. However, I'm having a hard time finding the P value
via the chart (which I'm required to learn how to do).I think the
chart immediately bellow this is the one used to find the p-value.
However, I know at least one (or more) of the charts bellow is
what's used. Please let me know which chart...
Most questions answered within 3 hours.
-
At the start of a CD it is spinning at a rate of 525 rpm
(revolutions...
asked 1 minute ago -
4. Without doing any calculations, predict whether the observed
∆T would increase, decrease or remain the...
asked 1 hour ago -
Based on the range, which of the following sets of scores has
the greatest variability? 3,...
asked 2 hours ago -
Ripples in a pond travel at a velocity of 3 m/s with one peak
passing a...
asked 2 hours ago -
A man stands on the roof of a building of height 13.0 mm and
throws a...
asked 2 hours ago -
The extent to which assets are financed by borrowed funds and
other liabilities is indicated by:...
asked 3 hours ago -
Explain in detail
Germany is the fifth largest economy
explain what goods and services Germany specializes...
asked 3 hours ago -
The density of platinum is 21.45 g/mL. If a cube of platinum
with a mass of...
asked 3 hours ago -
Accounts Receivable
Sales
A/R Posting
Extended Sales Invoice
Packing Slip
Compare invoice to packing slip 2...
asked 3 hours ago -
Michaella, age 23, is a full-time law student and is claimed by
her parents as a...
asked 3 hours ago -
Why are polymers not typically casted into products?
asked 4 hours ago -
When rolling a die 129 times, what is the probability of rolling
a 6 no more...
asked 4 hours ago