


(a) Does the evidence suggest that community college transfer students take longer to attain a bachelor's degree? Use an α = 0.05 level of significance. Perform a hypothesis test. Determine the null and alternative hypotheses.
(b) Determine the test statistic (t = ?) and the P-value (P = ?). Round to two decimal places as needed.
(c) Construct a 90% confidence interval for (μcommunity college − μno transfer) to approximate the mean additional time it takes to complete a bachelor's degree if you begin in community college. The bounds of a (1 − α) • 100% confidence interval about μ1 − μ2 can be found using the formulas, where tα/2 is the critical value. Round to six decimal places as needed.
(d) Construct a 95% confidence interval for (μcommunity college − μno transfer) to approximate the mean additional time it takes to complete a bachelor's degree if you begin in community college. The bounds of a (1 − α) • 100% confidence interval about μ1 − μ2 can be found using the formulas, where tα/2 is the critical value. Round to six decimal places as needed.
(e) Construct a 98% confidence interval for (μcommunity college − μno transfer) to approximate the mean additional time it takes to complete a bachelor's degree if you begin in community college. The bounds of a (1 − α) • 100% confidence interval about μ1 − μ2 can be found using the formulas, where tα/2 is the critical value. Round to six decimal places as needed.
Homework Answers
Given that,
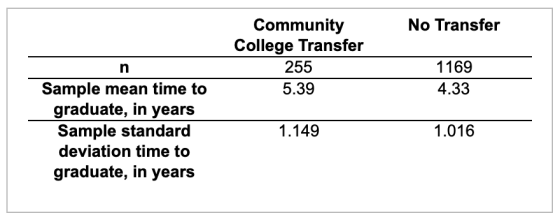
mean(x)=5.39
standard deviation , s.d1=1.149
number(n1)=255
y(mean)=4.33
standard deviation, s.d2 =1.016
number(n2)=1169
null, Ho: u1 = u2
alternate, H1: u1 > u2
level of significance, α = 0.05
from standard normal table,right tailed t α/2 =1.651
since our test is right-tailed
reject Ho, if to > 1.651
we use test statistic (t) = (x-y)/sqrt(s.d1^2/n1)+(s.d2^2/n2)
to =5.39-4.33/sqrt((1.3202/255)+(1.03226/1169))
to =13.616
| to | =13.616
critical value
the value of |t α| with min (n1-1, n2-1) i.e 254 d.f is 1.651
we got |to| = 13.61631 & | t α | = 1.651
make decision
hence value of | to | > | t α| and here we reject Ho
p-value:right tail - Ha : ( p > 13.6163 ) = 0
hence value of p0.05 > 0,here we reject Ho
ANSWERS
---------------
a.
null, Ho: u1 = u2
alternate, H1: u1 > u2
test statistic: 13.616
critical value: 1.651
decision: reject Ho
b.
p-value: 0
we have enough evidence to support the claim that whether the
student's who first attended community college took longer to
attain a bachelor's degree than
those who immediately attended ans remained at a 4 year
institution.
c.
TRADITIONAL METHOD
given that,
mean(x)=5.39
standard deviation , s.d1=1.149
number(n1)=255
y(mean)=4.33
standard deviation, s.d2 =1.016
number(n2)=1169
I.
standard error = sqrt(s.d1^2/n1)+(s.d2^2/n2)
where,
sd1, sd2 = standard deviation of both
n1, n2 = sample size
standard error = sqrt((1.320201/255)+(1.032256/1169))
= 0.077848
II.
margin of error = t a/2 * (standard error)
where,
t a/2 = t -table value
level of significance, α = 0.1
from standard normal table, two tailed and
value of |t α| with min (n1-1, n2-1) i.e 254 d.f is 1.650875
margin of error = 1.651 * 0.077848
= 0.128527
III.
CI = (x1-x2) ± margin of error
confidence interval = [ (5.39-4.33) ± 0.128527 ]
= [0.931473 , 1.188527]
-----------------------------------------------------------------------------------------------
DIRECT METHOD
given that,
mean(x)=5.39
standard deviation , s.d1=1.149
sample size, n1=255
y(mean)=4.33
standard deviation, s.d2 =1.016
sample size,n2 =1169
CI = x1 - x2 ± t a/2 * Sqrt ( sd1 ^2 / n1 + sd2 ^2 /n2 )
where,
x1,x2 = mean of populations
sd1,sd2 = standard deviations
n1,n2 = size of both
a = 1 - (confidence Level/100)
ta/2 = t-table value
CI = confidence interval
CI = [( 5.39-4.33) ± t a/2 *
sqrt((1.320201/255)+(1.032256/1169)]
= [ (1.06) ± t a/2 * 0.077848]
= [0.931473 , 1.188527]
-----------------------------------------------------------------------------------------------
interpretations:
1. we are 90% sure that the interval [0.931473 , 1.188527] contains
the true population proportion
2. If a large number of samples are collected, and a confidence
interval is created
for each sample, 90% of these intervals will contains the true
population proportion
d.
TRADITIONAL METHOD
given that,
mean(x)=5.39
standard deviation , s.d1=1.149
number(n1)=255
y(mean)=4.33
standard deviation, s.d2 =1.016
number(n2)=1169
I.
standard error = sqrt(s.d1^2/n1)+(s.d2^2/n2)
where,
sd1, sd2 = standard deviation of both
n1, n2 = sample size
standard error = sqrt((1.320201/255)+(1.032256/1169))
= 0.077848
II.
margin of error = t a/2 * (standard error)
where,
t a/2 = t -table value
level of significance, α = 0.05
from standard normal table, two tailed and
value of |t α| with min (n1-1, n2-1) i.e 254 d.f is 1.969348
margin of error = 1.969 * 0.077848
= 0.153282
III.
CI = (x1-x2) ± margin of error
confidence interval = [ (5.39-4.33) ± 0.153282 ]
= [0.906718 , 1.213282]
-----------------------------------------------------------------------------------------------
DIRECT METHOD
given that,
mean(x)=5.39
standard deviation , s.d1=1.149
sample size, n1=255
y(mean)=4.33
standard deviation, s.d2 =1.016
sample size,n2 =1169
CI = x1 - x2 ± t a/2 * Sqrt ( sd1 ^2 / n1 + sd2 ^2 /n2 )
where,
x1,x2 = mean of populations
sd1,sd2 = standard deviations
n1,n2 = size of both
a = 1 - (confidence Level/100)
ta/2 = t-table value
CI = confidence interval
CI = [( 5.39-4.33) ± t a/2 *
sqrt((1.320201/255)+(1.032256/1169)]
= [ (1.06) ± t a/2 * 0.077848]
= [0.906718 , 1.213282]
-----------------------------------------------------------------------------------------------
interpretations:
1. we are 95% sure that the interval [0.906718 , 1.213282] contains
the true population proportion
2. If a large number of samples are collected, and a confidence
interval is created
for each sample, 95% of these intervals will contains the true
population proportion
e.
TRADITIONAL METHOD
given that,
mean(x)=5.39
standard deviation , s.d1=1.149
number(n1)=255
y(mean)=4.33
standard deviation, s.d2 =1.016
number(n2)=1169
I.
standard error = sqrt(s.d1^2/n1)+(s.d2^2/n2)
where,
sd1, sd2 = standard deviation of both
n1, n2 = sample size
standard error = sqrt((1.320201/255)+(1.032256/1169))
= 0.077848
II.
margin of error = t a/2 * (standard error)
where,
t a/2 = t -table value
level of significance, α = 0.02
from standard normal table, two tailed and
value of |t α| with min (n1-1, n2-1) i.e 254 d.f is 2.341118
margin of error = 2.341 * 0.077848
= 0.182242
III.
CI = (x1-x2) ± margin of error
confidence interval = [ (5.39-4.33) ± 0.182242 ]
= [0.877758 , 1.242242]
-----------------------------------------------------------------------------------------------
DIRECT METHOD
given that,
mean(x)=5.39
standard deviation , s.d1=1.149
sample size, n1=255
y(mean)=4.33
standard deviation, s.d2 =1.016
sample size,n2 =1169
CI = x1 - x2 ± t a/2 * Sqrt ( sd1 ^2 / n1 + sd2 ^2 /n2 )
where,
x1,x2 = mean of populations
sd1,sd2 = standard deviations
n1,n2 = size of both
a = 1 - (confidence Level/100)
ta/2 = t-table value
CI = confidence interval
CI = [( 5.39-4.33) ± t a/2 *
sqrt((1.320201/255)+(1.032256/1169)]
= [ (1.06) ± t a/2 * 0.077848]
= [0.877758 , 1.242242]
-----------------------------------------------------------------------------------------------
interpretations:
1. we are 98% sure that the interval [0.877758 , 1.242242] contains
the true population proportion
2. If a large number of samples are collected, and a confidence
interval is created
for each sample, 98% of these intervals will contains the true
population proportion
Add Answer to:
(a) Does the evidence suggest that community
college transfer students take longer to attain a bachelor's...
(a) Determine the test statistic (t = ?). Round to two decimal places as needed. (b)...
 (a) Determine the test statistic (t =
?). Round to two decimal places as needed.
(b) Construct a 90% confidence interval for
μcommunity college − μno transfer to
approximate the mean additional time it takes to complete a
bachelor's degree if you begin in community college. The bounds of
a (1 − α) • 100% confidence interval about μ1 −
μ2 can be found using the following formulas, where
tα/2 is the critical value. Round to six decimal places
as...
(a) Determine the test statistic (t =
?). Round to two decimal places as needed.
(b) Construct a 90% confidence interval for
μcommunity college − μno transfer to
approximate the mean additional time it takes to complete a
bachelor's degree if you begin in community college. The bounds of
a (1 − α) • 100% confidence interval about μ1 −
μ2 can be found using the following formulas, where
tα/2 is the critical value. Round to six decimal places
as...
t-Distribution Area in Right Tail .
 t-Distribution Area in Right Tail
Degrees of Freedom 0.25 0.2
0.15 0.10 0.05
0.025 0.02 0.01
0.005 0.0025 0.001 0.0005
1 1.000 1.376 1.963
3.078 6.314 12.706
15.894 31.821 63.657
127.321 318.309 636.619
2 0.816 1.061 1.386
1.886 2.920 4.303
4.849 6.965 9.925
14.089 22.327 31.599
3 0.765 0.978 1.250
1.638 2.353 3.182
3.482 4.541 5.841
7.453 10.215 12.924
4 0.741 0.941 ...
t-Distribution Area in Right Tail
Degrees of Freedom 0.25 0.2
0.15 0.10 0.05
0.025 0.02 0.01
0.005 0.0025 0.001 0.0005
1 1.000 1.376 1.963
3.078 6.314 12.706
15.894 31.821 63.657
127.321 318.309 636.619
2 0.816 1.061 1.386
1.886 2.920 4.303
4.849 6.965 9.925
14.089 22.327 31.599
3 0.765 0.978 1.250
1.638 2.353 3.182
3.482 4.541 5.841
7.453 10.215 12.924
4 0.741 0.941 ...
t-distribution Table -Distribution Area in Right Tail 0.025 0.02 df 0.25 0.20 0.15 0.10 0.05 0.01...
 t-distribution Table -Distribution Area in Right Tail 0.025 0.02 df 0.25 0.20 0.15 0.10 0.05 0.01 0.005 0.0025 0.001 0.0005 3 6 1.000 1.3761.963 0.816 1.061 1.386 0.765 0.978 1.250 0.741 0.941 1.190 0.727 0.9201.156 0.718 0.906 1.134 0.7110.8961.119 0.706 0.889 1.108 0.703 0.883 1.100 0.700 0.879 1.093 0.697 0.876 1.088 0.695 0.873 1.083 0.694 0.870 1.079 0.692 0.868 1.076 0.691 0.866 1.074 0.690 0.865 1.071 0.689 0.863 1.069 0.688 0.862 1.067 0.688 0.861 1.066 3.078 1.886 1.638 1.533 1.476...
(a) Is there a difference in the measurement of the muzzle velocity between device A and...
 (a) Is there a difference
in the measurement of the muzzle velocity between device A and
device B at the α = 0.01 level of significance? Note: A normal
probability plot and boxplot of the data indicate that the
differences are approximately normally distributed with no
outliers. Let di = Ai − Bi.
(i) Identify the null and alternative
hypotheses.
(ii) Determine the test statistic for
this hypothesis test (t0 = ?). Round to two
decimal places as needed.
(iii)...
(a) Is there a difference
in the measurement of the muzzle velocity between device A and
device B at the α = 0.01 level of significance? Note: A normal
probability plot and boxplot of the data indicate that the
differences are approximately normally distributed with no
outliers. Let di = Ai − Bi.
(i) Identify the null and alternative
hypotheses.
(ii) Determine the test statistic for
this hypothesis test (t0 = ?). Round to two
decimal places as needed.
(iii)...
9.2.17 Question Help A simple random sample of size nis drawn from a population that is...
 9.2.17 Question Help A simple random sample of size nis drawn from a population that is normally distributed. The sample mean, X, is found to be 106, and the sample standard deviations, is found to be 10. (a) Construct a 96% confidence interval about if the sample size, n, is 17 (b) Construct a 96% confidence interval about if the sample size, n, is 22 (c) Construct a 98% confidence interval about if the sample size, n, is 17 id...
T Distribution Table The U.S. Dairy Industry wants to estimate the mean yearly milk consumption. A...
 T Distribution Table
The U.S. Dairy Industry wants to estimate the mean yearly milk consumption. A sample of 25 people reveals the mean yearly consumption to be 82 gallons with a standard deviation of 24 gallons. Assume that the population distribution is normal. (Use Distribution Table.) a-1. What is the value of the population mean? 82 24 Unknown a-2. What is the best estimate of this value? Estimate population mean c. For a 90% confidence interval, what is the value...
T Distribution Table
The U.S. Dairy Industry wants to estimate the mean yearly milk consumption. A sample of 25 people reveals the mean yearly consumption to be 82 gallons with a standard deviation of 24 gallons. Assume that the population distribution is normal. (Use Distribution Table.) a-1. What is the value of the population mean? 82 24 Unknown a-2. What is the best estimate of this value? Estimate population mean c. For a 90% confidence interval, what is the value...
I ONLY NEED HELP WITH PART OF PART "B" I've figured out the test statistic is -1.73 and the degr...
 I ONLY NEED HELP WITH PART OF PART "B"
I've figured out the test statistic is -1.73 and the degrees of
freedom are 5. However, I'm having a hard time finding the P value
via the chart (which I'm required to learn how to do).I think the
chart immediately bellow this is the one used to find the p-value.
However, I know at least one (or more) of the charts bellow is
what's used. Please let me know which chart...
I ONLY NEED HELP WITH PART OF PART "B"
I've figured out the test statistic is -1.73 and the degrees of
freedom are 5. However, I'm having a hard time finding the P value
via the chart (which I'm required to learn how to do).I think the
chart immediately bellow this is the one used to find the p-value.
However, I know at least one (or more) of the charts bellow is
what's used. Please let me know which chart...
I ONLY NEED HELP WITH PART OF PART "B" I've figured out the test statistic is...
 I ONLY NEED HELP WITH PART OF PART "B"
I've figured out the test statistic is -1.73 and the degrees of
freedom are 5. However, I'm having a hard time finding the P value
via the chart (which I'm required to learn how to do).I think the
chart immediately bellow this is the one used to find the p-value.
However, I know at least one (or more) of the charts bellow is
what's used. Please let me know which chart...
I ONLY NEED HELP WITH PART OF PART "B"
I've figured out the test statistic is -1.73 and the degrees of
freedom are 5. However, I'm having a hard time finding the P value
via the chart (which I'm required to learn how to do).I think the
chart immediately bellow this is the one used to find the p-value.
However, I know at least one (or more) of the charts bellow is
what's used. Please let me know which chart...
 (a) Determine the test statistic (t =
?). Round to two decimal places as needed.
(b) Construct a 90% confidence interval for
μcommunity college − μno transfer to
approximate the mean additional time it takes to complete a
bachelor's degree if you begin in community college. The bounds of
a (1 − α) • 100% confidence interval about μ1 −
μ2 can be found using the following formulas, where
tα/2 is the critical value. Round to six decimal places
as...
(a) Determine the test statistic (t =
?). Round to two decimal places as needed.
(b) Construct a 90% confidence interval for
μcommunity college − μno transfer to
approximate the mean additional time it takes to complete a
bachelor's degree if you begin in community college. The bounds of
a (1 − α) • 100% confidence interval about μ1 −
μ2 can be found using the following formulas, where
tα/2 is the critical value. Round to six decimal places
as...
 t-Distribution Area in Right Tail
Degrees of Freedom 0.25 0.2
0.15 0.10 0.05
0.025 0.02 0.01
0.005 0.0025 0.001 0.0005
1 1.000 1.376 1.963
3.078 6.314 12.706
15.894 31.821 63.657
127.321 318.309 636.619
2 0.816 1.061 1.386
1.886 2.920 4.303
4.849 6.965 9.925
14.089 22.327 31.599
3 0.765 0.978 1.250
1.638 2.353 3.182
3.482 4.541 5.841
7.453 10.215 12.924
4 0.741 0.941 ...
t-Distribution Area in Right Tail
Degrees of Freedom 0.25 0.2
0.15 0.10 0.05
0.025 0.02 0.01
0.005 0.0025 0.001 0.0005
1 1.000 1.376 1.963
3.078 6.314 12.706
15.894 31.821 63.657
127.321 318.309 636.619
2 0.816 1.061 1.386
1.886 2.920 4.303
4.849 6.965 9.925
14.089 22.327 31.599
3 0.765 0.978 1.250
1.638 2.353 3.182
3.482 4.541 5.841
7.453 10.215 12.924
4 0.741 0.941 ...
 t-distribution Table -Distribution Area in Right Tail 0.025 0.02 df 0.25 0.20 0.15 0.10 0.05 0.01 0.005 0.0025 0.001 0.0005 3 6 1.000 1.3761.963 0.816 1.061 1.386 0.765 0.978 1.250 0.741 0.941 1.190 0.727 0.9201.156 0.718 0.906 1.134 0.7110.8961.119 0.706 0.889 1.108 0.703 0.883 1.100 0.700 0.879 1.093 0.697 0.876 1.088 0.695 0.873 1.083 0.694 0.870 1.079 0.692 0.868 1.076 0.691 0.866 1.074 0.690 0.865 1.071 0.689 0.863 1.069 0.688 0.862 1.067 0.688 0.861 1.066 3.078 1.886 1.638 1.533 1.476...
 (a) Is there a difference
in the measurement of the muzzle velocity between device A and
device B at the α = 0.01 level of significance? Note: A normal
probability plot and boxplot of the data indicate that the
differences are approximately normally distributed with no
outliers. Let di = Ai − Bi.
(i) Identify the null and alternative
hypotheses.
(ii) Determine the test statistic for
this hypothesis test (t0 = ?). Round to two
decimal places as needed.
(iii)...
(a) Is there a difference
in the measurement of the muzzle velocity between device A and
device B at the α = 0.01 level of significance? Note: A normal
probability plot and boxplot of the data indicate that the
differences are approximately normally distributed with no
outliers. Let di = Ai − Bi.
(i) Identify the null and alternative
hypotheses.
(ii) Determine the test statistic for
this hypothesis test (t0 = ?). Round to two
decimal places as needed.
(iii)...
 9.2.17 Question Help A simple random sample of size nis drawn from a population that is normally distributed. The sample mean, X, is found to be 106, and the sample standard deviations, is found to be 10. (a) Construct a 96% confidence interval about if the sample size, n, is 17 (b) Construct a 96% confidence interval about if the sample size, n, is 22 (c) Construct a 98% confidence interval about if the sample size, n, is 17 id...
 T Distribution Table
The U.S. Dairy Industry wants to estimate the mean yearly milk consumption. A sample of 25 people reveals the mean yearly consumption to be 82 gallons with a standard deviation of 24 gallons. Assume that the population distribution is normal. (Use Distribution Table.) a-1. What is the value of the population mean? 82 24 Unknown a-2. What is the best estimate of this value? Estimate population mean c. For a 90% confidence interval, what is the value...
T Distribution Table
The U.S. Dairy Industry wants to estimate the mean yearly milk consumption. A sample of 25 people reveals the mean yearly consumption to be 82 gallons with a standard deviation of 24 gallons. Assume that the population distribution is normal. (Use Distribution Table.) a-1. What is the value of the population mean? 82 24 Unknown a-2. What is the best estimate of this value? Estimate population mean c. For a 90% confidence interval, what is the value...
 I ONLY NEED HELP WITH PART OF PART "B"
I've figured out the test statistic is -1.73 and the degrees of
freedom are 5. However, I'm having a hard time finding the P value
via the chart (which I'm required to learn how to do).I think the
chart immediately bellow this is the one used to find the p-value.
However, I know at least one (or more) of the charts bellow is
what's used. Please let me know which chart...
I ONLY NEED HELP WITH PART OF PART "B"
I've figured out the test statistic is -1.73 and the degrees of
freedom are 5. However, I'm having a hard time finding the P value
via the chart (which I'm required to learn how to do).I think the
chart immediately bellow this is the one used to find the p-value.
However, I know at least one (or more) of the charts bellow is
what's used. Please let me know which chart...
Most questions answered within 3 hours.
-
A student takes a multiple-choice test that has 10 questions.
Each question has two choices. The...
asked 6 minutes ago -
Willie Keeler has a lifetime batting average of 0.341. Assume
that Willie Keeler came to bat...
asked 7 minutes ago -
Which of the following has the highest boiling point?
A) 0.5m NaCl
B) 0.5m C6H12O6
C)...
asked 26 minutes ago -
12. A firm is producing at an output level where
AR = MC > AC >...
asked 23 minutes ago -
Radovilsky Manufacturing Company, in Hayward, California,
makes flashing lights for toys. The company operates its production...
asked 26 minutes ago -
As an athlete exercises, sweat is produced and evaporated to
jelp maintain a proper body temperature....
asked 25 minutes ago -
Which of these macromolecules is most prevalent (by mass) in the
environment? What particular challenge does...
asked 27 minutes ago -
Consider two stocks. Stock A has a standard deviation of 46% and
stock B has a...
asked 31 minutes ago -
Give a unary language (using only input alphabet ∑={1} )that is
not Turing- recognizable and prove...
asked 42 minutes ago -
1. Write the balanced net reaction for a Ti (s) | TiCl2 (aq) ||
InCl3 (aq)...
asked 39 minutes ago -
3) Answer the following questions:please respond in one
paragraph
In your opinion, what are the crucial...
asked 45 minutes ago -
Assume that the readings at freezing on a batch of thermometers
are normally distributed with a...
asked 51 minutes ago