I ONLY NEED HELP WITH PART OF PART "B"

I've figured out the test statistic is -1.73 and the degrees of
freedom are 5. However, I'm having a hard time finding the P value
via the chart (which I'm required to learn how to do).I think the
chart immediately bellow this is the one used to find the p-value.
However, I know at least one (or more) of the charts bellow is
what's used. Please let me know which chart is the one used to find
the p-value (using the t-value) and how it can be done from its
usage (or of there are multiple from their usages).


Homework Answers
Answer a)
For doing hypothesis testing first we need to calculate mean and standard deviation of data provided:

x̅ = (400+500+600+600+700+800)/6 = 3600/6 = 600

s = 141.4214
Answer b)


Thus, it can be concluded that couple's sample average is less than true average not by pure confidence.
For your question related to p-value:
There are two ways to test hypothesis. One is critical value approach and other is p- value approach. The result of the hypothesis testing will be same using both approaches.
Critical Value Approach:
In this approach, first we have to find out critical t value using the t-distribution table. Then we compare the critical t-value with the test statistics. If the magnitude of test statistic is greater than critical t-value, we reject null hypothesis.
In this case, to determine critical t value we need following:
Degree of freedom df = 6 -1 = 5
α = 0.10 (One tailed test)
Critical t value for α = 0.10 and df = 5 is 1.476 (Screenshot to show how we located t-value is attached)

In this case, since the magnitude of test statistic (1.732) is greater than critical t-value (1.476), so we reject null hypothesis
P-value Approach
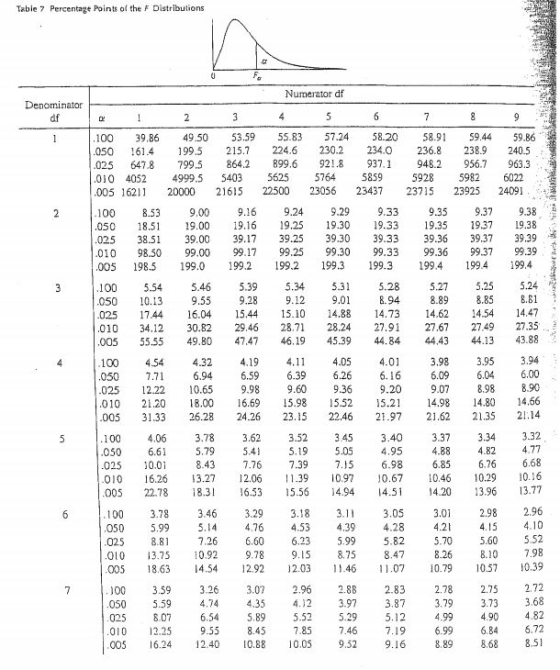
Please not that using table, you cannot determine the exact p-value. You can only find out range.
In this case, for determining p-value we need two things:
Test statistics = 1.732
Degree of freedom df = 6 -1 = 5
P-value is between 0.10 < p < 0.05 (Screenshot to show how we find out range is attached)

In the t-distribution table, we need to see the row corresponding to df = 5. Now, our test statistics lies between 1.476 and 2.015. P-value (one tail) corresponding to 1.476 and 2.015 is 0.10 and 0.05 respectively. So, p-value lies between 0.05 and 0.10.
You can determine exact p-value using online calculator. The exact p-value is 0.0719 which is between 0.05 and 0.10.
In this case, since p value is less than α = 0.10 so we reject null hypothesis.
Add Answer to:
I ONLY NEED HELP WITH PART OF PART "B"
I've figured out the test statistic is...
I ONLY NEED HELP WITH PART OF PART "B" I've figured out the test statistic is -1.73 and the degr...
 I ONLY NEED HELP WITH PART OF PART "B"
I've figured out the test statistic is -1.73 and the degrees of
freedom are 5. However, I'm having a hard time finding the P value
via the chart (which I'm required to learn how to do).I think the
chart immediately bellow this is the one used to find the p-value.
However, I know at least one (or more) of the charts bellow is
what's used. Please let me know which chart...
I ONLY NEED HELP WITH PART OF PART "B"
I've figured out the test statistic is -1.73 and the degrees of
freedom are 5. However, I'm having a hard time finding the P value
via the chart (which I'm required to learn how to do).I think the
chart immediately bellow this is the one used to find the p-value.
However, I know at least one (or more) of the charts bellow is
what's used. Please let me know which chart...
help please! ignore my work as i tried to get the answers! Find the z score...
 help please!
ignore my work as i tried to get the answers!
Find the z score if the NON-shaded region indicated by the arrow is .0991 Round to 4 decimal places -.5.0991 2.4009 25 0991 Applicable z score(s) Final probability as a 4 place decimal IF APPLICABLE Movie theater managers measured the number of scenes in Scary Movie that produced laughter and found the average to be 82.1 separate scenes with stdev =13.06 scenes. Statisticians tested adqiç audiences and found...
help please!
ignore my work as i tried to get the answers!
Find the z score if the NON-shaded region indicated by the arrow is .0991 Round to 4 decimal places -.5.0991 2.4009 25 0991 Applicable z score(s) Final probability as a 4 place decimal IF APPLICABLE Movie theater managers measured the number of scenes in Scary Movie that produced laughter and found the average to be 82.1 separate scenes with stdev =13.06 scenes. Statisticians tested adqiç audiences and found...
t-Distribution Table Find the critical value t, for the confidence level c0 80 and sample size...
 t-Distribution Table Find the critical value t, for the confidence level c0 80 and sample size n 9 Click the icon to view the t-distribution table. (Round to the nearest thousandth as needed ) Level of confidence, c 0.80 0.90 0.95 0.98 0.9 One tall a 0.10 0.05 0.025 0.01 0.05 d. Two talls, α 0.20 0.10 005 002 001 du 3.078 6 314 12.706 31.821 63.657 1886 2920 4303 6965 9925 2 638 2.353 3.182 4541 5.841 1.533 2.132...
Could you please help me with questions 1a-1b please? ( since i could only find the formula neede...
 Could you please help me with questions 1a-1b please? ( since i
could only find the formula needed for 1a, if u aren't sure with 1b
u can just do 1a but please dont reply "no enough data given "
because i have a lil systemical problem with replying the comments)
* the first question was asked to complete the anova table (
table 9.1 in the picture ) by using the formulas ( in the
pictures)
* I have...
Could you please help me with questions 1a-1b please? ( since i
could only find the formula needed for 1a, if u aren't sure with 1b
u can just do 1a but please dont reply "no enough data given "
because i have a lil systemical problem with replying the comments)
* the first question was asked to complete the anova table (
table 9.1 in the picture ) by using the formulas ( in the
pictures)
* I have...
Gain (V/V) R Setting Totals Averages Sample 1 Sample 2 Sample 3 4 ап 7.8 8.1...
 Gain (V/V) R Setting Totals Averages Sample 1 Sample 2 Sample 3 4 ап 7.8 8.1 7.9 3 5.2 6.0 4.3 = 359.3 i=1 j=1 2 4.4 6.9 3.8 1 2.0 1.7 0.8 This is actual data from one of Joe Tritschler's audio engineering experiments. Use Analysis of Variance (ANOVA) to test the null hypothesis that the treatment means are equal at the a = 0.05 level of significance. Fill in the ANOVA table. Source of Variation Sum of Squares...
Suppose 1000 coins are tossed. Use the normal curve approximation to the binomial distribution to find...
 Suppose 1000 coins are tossed. Use the normal curve approximation to the binomial distribution to find the probability of getting the following result. Exactly 495 heads Use the table of areas under the standard normal curve given below. Click here to view page 1. Click here to view page 2. Click here to view page 3. Click here to view page 4. Click here to view page 5. Click here to view page 6. The probability of getting exactly 495...
Suppose 16 coins are tossed. Use the normal curve approximation to the binomial distribution to find...
 Suppose 16 coins are tossed. Use the normal curve approximation to the binomial distribution to find the probability of getting the following result. More than 11 tails. Use the table of areas under the standard normal curve given below. Click here to view page 1. Click here to view page 2. Click here to view page 3. Click here to view page 4. Click here to view page 5. Click here to view page 6. Binomial probability = (Round to...
 I ONLY NEED HELP WITH PART OF PART "B"
I've figured out the test statistic is -1.73 and the degrees of
freedom are 5. However, I'm having a hard time finding the P value
via the chart (which I'm required to learn how to do).I think the
chart immediately bellow this is the one used to find the p-value.
However, I know at least one (or more) of the charts bellow is
what's used. Please let me know which chart...
I ONLY NEED HELP WITH PART OF PART "B"
I've figured out the test statistic is -1.73 and the degrees of
freedom are 5. However, I'm having a hard time finding the P value
via the chart (which I'm required to learn how to do).I think the
chart immediately bellow this is the one used to find the p-value.
However, I know at least one (or more) of the charts bellow is
what's used. Please let me know which chart...
 help please!
ignore my work as i tried to get the answers!
Find the z score if the NON-shaded region indicated by the arrow is .0991 Round to 4 decimal places -.5.0991 2.4009 25 0991 Applicable z score(s) Final probability as a 4 place decimal IF APPLICABLE Movie theater managers measured the number of scenes in Scary Movie that produced laughter and found the average to be 82.1 separate scenes with stdev =13.06 scenes. Statisticians tested adqiç audiences and found...
help please!
ignore my work as i tried to get the answers!
Find the z score if the NON-shaded region indicated by the arrow is .0991 Round to 4 decimal places -.5.0991 2.4009 25 0991 Applicable z score(s) Final probability as a 4 place decimal IF APPLICABLE Movie theater managers measured the number of scenes in Scary Movie that produced laughter and found the average to be 82.1 separate scenes with stdev =13.06 scenes. Statisticians tested adqiç audiences and found...
 t-Distribution Table Find the critical value t, for the confidence level c0 80 and sample size n 9 Click the icon to view the t-distribution table. (Round to the nearest thousandth as needed ) Level of confidence, c 0.80 0.90 0.95 0.98 0.9 One tall a 0.10 0.05 0.025 0.01 0.05 d. Two talls, α 0.20 0.10 005 002 001 du 3.078 6 314 12.706 31.821 63.657 1886 2920 4303 6965 9925 2 638 2.353 3.182 4541 5.841 1.533 2.132...
 Could you please help me with questions 1a-1b please? ( since i
could only find the formula needed for 1a, if u aren't sure with 1b
u can just do 1a but please dont reply "no enough data given "
because i have a lil systemical problem with replying the comments)
* the first question was asked to complete the anova table (
table 9.1 in the picture ) by using the formulas ( in the
pictures)
* I have...
Could you please help me with questions 1a-1b please? ( since i
could only find the formula needed for 1a, if u aren't sure with 1b
u can just do 1a but please dont reply "no enough data given "
because i have a lil systemical problem with replying the comments)
* the first question was asked to complete the anova table (
table 9.1 in the picture ) by using the formulas ( in the
pictures)
* I have...
 Gain (V/V) R Setting Totals Averages Sample 1 Sample 2 Sample 3 4 ап 7.8 8.1 7.9 3 5.2 6.0 4.3 = 359.3 i=1 j=1 2 4.4 6.9 3.8 1 2.0 1.7 0.8 This is actual data from one of Joe Tritschler's audio engineering experiments. Use Analysis of Variance (ANOVA) to test the null hypothesis that the treatment means are equal at the a = 0.05 level of significance. Fill in the ANOVA table. Source of Variation Sum of Squares...
 Gain (V/V) R Setting Totals Averages Sample 1 Sample 2 Sample 3 4 ап 7.8 8.1 7.9 3 5.2 6.0 4.3 = 359.3 i=1 j=1 2 4.4 6.9 3.8 1 2.0 1.7 0.8 This is actual data from one of Joe Tritschler's audio engineering experiments. Use Analysis of Variance (ANOVA) to test the null hypothesis that the treatment means are equal at the a = 0.05 level of significance. Fill in the ANOVA table. Source of Variation Sum of Squares...
 Suppose 1000 coins are tossed. Use the normal curve approximation to the binomial distribution to find the probability of getting the following result. Exactly 495 heads Use the table of areas under the standard normal curve given below. Click here to view page 1. Click here to view page 2. Click here to view page 3. Click here to view page 4. Click here to view page 5. Click here to view page 6. The probability of getting exactly 495...
 Suppose 16 coins are tossed. Use the normal curve approximation to the binomial distribution to find the probability of getting the following result. More than 11 tails. Use the table of areas under the standard normal curve given below. Click here to view page 1. Click here to view page 2. Click here to view page 3. Click here to view page 4. Click here to view page 5. Click here to view page 6. Binomial probability = (Round to...
Most questions answered within 3 hours.
-
state one specific part from disability law such as ADA
(Americans with Disability Acts) or policy...
asked 31 seconds ago -
please simplify how vapor pressure lowering is related to a
rise in the boiling point solution
asked 15 minutes ago -
write a java program that does the following
Part one
Use a For loop to compute...
asked 12 minutes ago -
"A student in another class made a claim that many people are
now talking about outlawing...
asked 14 minutes ago -
Test the hypothesis using P-value approach. Be sure to verify
the requirements of the test.
H0:...
asked 56 minutes ago -
For a voltaic cell based on the reaction below, which statement
is correct?
Zn(s)+2H+(aq)→Zn2+(aq)+H2(g)
Zn2+(aq) is...
asked 41 minutes ago -
If 20 g of Na2SO4 is reacted with 20 g of
Al(NO3)3 according to the following...
asked 32 minutes ago -
One difference between periodic and perpetual inventory systems
is:
Multiple Choice Cost of goods sold is...
asked 38 minutes ago -
Using the OSHA web site find the OSHA regulation for personal eye
protection. Write a summary...
asked 36 minutes ago -
In 600 words, answer the following
1) Why has the transfer of defense technologies to domestic...
asked 36 minutes ago -
Balance the following oxidation-reduction equations using redox
methods:
Cu + H+ --------> Cu+ +
H2
asked 57 minutes ago -
For the balanced reaction: CaCl2 (aq) + Na2CO3 (aq) -> CaCO3
(s) + 2 NaCl (aq),...
asked 51 minutes ago