


outline. Replace Shape Effects D Select Drawing Editing 8.3 Model II ANOVA General equations for calculating Sums of Squares SSTotal = 2 ij T2 T2 ni N SSTreat- STotal = SSTreat + SSError
The ANOVA Table The sum of squares divided by the appropriate degrees of freedom generate mean squares that can be used to test hypotheses about means SSTreat MSTreatk-1 MSBlocksb-1 MSError = (k-1)(b-1) SSBlocks SSError These summary statistics usually are presented in an ANOVA Table, see Table 9.1. TABLE 9.1. The analysis of variance table for a randomized complete block design Source of variation Sum of squares Treatments Blocks Error Total df MS C.V. SSTreat SSBlocks SSError SSTotal Error SS (k - 1)(b - 1) kb-1
Data after conditions are applied (8 observations for each, 0.1 added to Data set B, and 0.2 added to Data set C) Data set A Data Set C Data set B Close Date 4/2/201861.240001 4/3/201862.780002 /4/2018 64.479999 4/5/2018 64.860004 4/6/2018 63.580001 4/9/201863.510001 Date Close Date Close 3/2/2018 67.459999 3/19/2018 63.730001 3/5/2018 68.309998 3/20/2018 63.039999 3/6/2018 67.650002 3/21/2018 62.519998 3/7/2018 67.510002 3/22/2018 61.890001 3/8/2018 68.360001 3/23/2018 60.960001 3/9/2018 69.269997 3/26/2018 61.699998 3/12/2018 69.010002 3/27/2018 60.699998 4/10/2018 64.170001 3/13/2018 68.25 3/28/2018 62.809999 4/11/2018 63.27
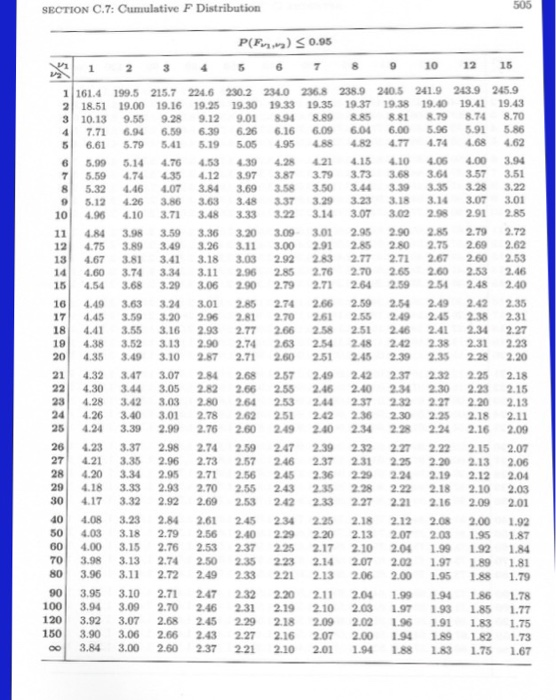
SECTION C.7: Cumulative F Distribution P(F)S.95 1 23 456710 1215 1 161.4 199.5 215.7 224.6 2502 234.0 8 238.9 2405 241.9 243.9 245.9 2 18.51 19.00 19.16 1925 19.30 19.33 19.35 19.37 19.38 19.40 19.41 19.43 3 10.13 9.55 9.28 9.12 9.01 8.94 8.89 8.85 8.81 8.798.74 8.70 4 7.71 6.94 6.59 6.39 6.26 6.16 6.09 6.04 6.00 5.965.91 5.86 5 6.61 5.79 5.41 5.195.05 4.95 488 482 477 4.74468 62 6 5.99 5.14 4.76 53 4.39 4.28 421 4.15 4.10 4.06 4.00 3.94 7 559 4.74 4.35 .12 397 387 379 373 368 3.643.57 3.51 8 5.32 4.46 4.07 3.843.69 358 3.503.44 3.39 3.35 328 3.22 5.12 426 3.86 3.63 3.483.37 3.29 3.23 3.183.14 3.07 3.01 0 4.96 4.10 3.71 3.48 3.33 322 314 3.07 322.98 291 2.85 11 484 3.98 3.59 3.36 3.20 9 3.01 2.95 2.902.85 2.79 2.72 24.75 3.89 3.49 3.26 311 3.00 2.91 2.85 280 2.75 2.69 2.62 134.67 3.81 3.41 3.18 3.03 2.92 283 277 2.71 267 2.60 2.53 14 4.60 3.74 3.34 3.11 2.96 2.85 2.76 2.70 2.652.60 253 2.46 15 4.54 3.68 3.29 3.06 2.90 2.79 2.71 264 259 254 2.48 2.40 164.49 3.63 324 3.01 285 2.74 266 2.59 2.54 2.49 2.42 2.35 17 4.45 3.59 3.20 2.96 2.81 2.70 2.61 2.55 249 2.45 2.38 2.31 18 4.41 3.55 3.16 2.93 2.77 2.66 2.58 2.51 246 241 2.34 2.27 19 4.38 3.52 3.13 2.90 2.74 2.63 254 248 242 238 2.31 2.23 20 4.35 3.49 3.10 2.87 2.71 260 251 245 2.39 2.35 228 2.20 21 4.32 3.47 3.07 2.84 2.68 257 2.49 242 2.37 2.32 2.25 2.18 224.30 3.44 3.05 2.82 266 255 2.46 240 2.34 2.30 2.23 2.15 234.28 3.42 3.03 2.80 264 253 2.44 237 2.32 2.27 2.20 2.13 24 4.26 3.40 3.01 2.78 262251 242 2.36 2.30 225 2.18 2.11 254.4 3.39 2.99 276 260 249 240 2.34 228 224 2.16 2.09 264.23 3.37 2.98 2.74 259 247 2.39 232 2 222 215 2.07 74.21 3.35 2.96 2.73 257 246 2.37 231 2.25 2.20 2.13 2.06 28 420 3.34 2.95 2.71 256 245 2.36 229 2.24 2.19 2.12 2.04 24.18 3.33 2.93 2.70 2.55 243 2.35 2.28 222 218 2.10 2.03 0 4.17 3.32 2.92 2.69 253 242 233 227 2.21 2.16 2.09 2.01 4.08 3.23 2.84 2.61 245 234 225 2.18 2.12 2.08 2.00 1.92 0 4.03 3.18 2.79 2.56 2.40 229 220 213 2.07 2.03 1.951.87 60 4.00 3.15 2.76 253 237 225 2.17 2.10 2.04 1.99 192 1.84 0 3.98 3.13 2.74 2.50 2.35 223 2.14 207 2.02 1.97 1891.81 0 3.96 3.11 2.72 2.49 2.33 221 213 2.06 2.00 1.95 1.88 1.79 901 3.95 3.10 2.71 2.47 232 2.20 2.11 2.04 1.99 194 i36 L78 100 3.94 3.09 2.70 246 23 219 210 2.03 197 193 1.85 1.77 120 3.92 3.07 2.68 245 229 218 209 2.02 196 191 1.83 1.75 50 3.90 3.06 266 243 227 216 207 2.00 194 1.89 182 1.73 oo 3.843.00 260 237 221 210 2.01 194 188 183 1.75 1.67
Homework Answers


Add Answer to:
Could you please help me with questions 1a-1b please? ( since i could only find the formula neede...
Show work if possible please An experiment has a single factor with five groups and five values in each group. freedom....
 Show work if possible please
An experiment has a single factor with five groups and five values in each group. freedom. In determining the total variation, there are: determining the among-group variation, there are 4 degrees freedom. In determining the within-group variation, there are 20 degrees of degrees of freedom. Also, note that SSA 96, SsW 120, SST = 216, MSA 24. MSW 6, and FSTAT 4. Complete parts (a) through (d). Click here to view page 1 of the...
Show work if possible please
An experiment has a single factor with five groups and five values in each group. freedom. In determining the total variation, there are: determining the among-group variation, there are 4 degrees freedom. In determining the within-group variation, there are 20 degrees of degrees of freedom. Also, note that SSA 96, SsW 120, SST = 216, MSA 24. MSW 6, and FSTAT 4. Complete parts (a) through (d). Click here to view page 1 of the...
REGRESSION 2 • reg bught cigs faminc male Source SS df MS = = Model Residual...
 REGRESSION 2 • reg bught cigs faminc male Source SS df MS = = Model Residual 20477.12 554134.6 3 6825.70666 1,384 400.386272 Number of obs F(3, 1384) Prob > R-squared Adj R-squared Root MSE 1,388 17.05 0.0000 0.0356 0.0335 20.01 - Total 574611.72 1,387 414.283864 bwght Coef. Std. Err. Piti (95Conf. Intervall cigs famine male _cons -.4610457 0913378 .09687980291453 3.113968 1.076396 115.2277 1.20788 -5.050.000 3.32 0.001 2.89 0.004 95.400.000 -.6402212 .0397062 1.002423 112.8582 - 2818702 .1540535 5.225513 117.5972 f) Conduct...
1. Two manufacturing processes are being compared to try to reduce the number of defective products...
 1. Two manufacturing processes are being compared to try to reduce the number of defective products made. During 8 shifts for each process, the following results were observed: Line A Line B n 181 | 187 Based on a 5% significance level, did line B have a larger average than line A? *Use the tables I gave you in the handouts for the critical values *Use the appropriate test statistic value, NOT the p-value method *Use and show the 5...
Gain (V/V) R Setting Totals Averages Sample 1 Sample 2 Sample 3 4 ап 7.8 8.1...
 Gain (V/V) R Setting Totals Averages Sample 1 Sample 2 Sample 3 4 ап 7.8 8.1 7.9 3 5.2 6.0 4.3 = 359.3 i=1 j=1 2 4.4 6.9 3.8 1 2.0 1.7 0.8 This is actual data from one of Joe Tritschler's audio engineering experiments. Use Analysis of Variance (ANOVA) to test the null hypothesis that the treatment means are equal at the a = 0.05 level of significance. Fill in the ANOVA table. Source of Variation Sum of Squares...
Suppose 1000 coins are tossed. Use the normal curve approximation to the binomial distribution to find...
 Suppose 1000 coins are tossed. Use the normal curve approximation to the binomial distribution to find the probability of getting the following result. Exactly 495 heads Use the table of areas under the standard normal curve given below. Click here to view page 1. Click here to view page 2. Click here to view page 3. Click here to view page 4. Click here to view page 5. Click here to view page 6. The probability of getting exactly 495...
Suppose 16 coins are tossed. Use the normal curve approximation to the binomial distribution to find...
 Suppose 16 coins are tossed. Use the normal curve approximation to the binomial distribution to find the probability of getting the following result. More than 11 tails. Use the table of areas under the standard normal curve given below. Click here to view page 1. Click here to view page 2. Click here to view page 3. Click here to view page 4. Click here to view page 5. Click here to view page 6. Binomial probability = (Round to...
I ONLY NEED HELP WITH PART OF PART "B" I've figured out the test statistic is...
 I ONLY NEED HELP WITH PART OF PART "B"
I've figured out the test statistic is -1.73 and the degrees of
freedom are 5. However, I'm having a hard time finding the P value
via the chart (which I'm required to learn how to do).I think the
chart immediately bellow this is the one used to find the p-value.
However, I know at least one (or more) of the charts bellow is
what's used. Please let me know which chart...
I ONLY NEED HELP WITH PART OF PART "B"
I've figured out the test statistic is -1.73 and the degrees of
freedom are 5. However, I'm having a hard time finding the P value
via the chart (which I'm required to learn how to do).I think the
chart immediately bellow this is the one used to find the p-value.
However, I know at least one (or more) of the charts bellow is
what's used. Please let me know which chart...
I ONLY NEED HELP WITH PART OF PART "B" I've figured out the test statistic is -1.73 and the degr...
 I ONLY NEED HELP WITH PART OF PART "B"
I've figured out the test statistic is -1.73 and the degrees of
freedom are 5. However, I'm having a hard time finding the P value
via the chart (which I'm required to learn how to do).I think the
chart immediately bellow this is the one used to find the p-value.
However, I know at least one (or more) of the charts bellow is
what's used. Please let me know which chart...
I ONLY NEED HELP WITH PART OF PART "B"
I've figured out the test statistic is -1.73 and the degrees of
freedom are 5. However, I'm having a hard time finding the P value
via the chart (which I'm required to learn how to do).I think the
chart immediately bellow this is the one used to find the p-value.
However, I know at least one (or more) of the charts bellow is
what's used. Please let me know which chart...
Write the C program, to achieve as shown in the sample code execution, using the given...
Write the C program, to achieve as shown in the sample code execution, using the given struct and using the comments in the given main program below: typedef struct{ char first[20]; char last[20]; float gpa; int score; } student; int main(void){ student *ptr; //first name //last name //student gpa //student score } //ask a user to enter the number of students, num //dynamically allocate memory for an array of students of the appropriate size (i.e. //num that the user just...
 Show work if possible please
An experiment has a single factor with five groups and five values in each group. freedom. In determining the total variation, there are: determining the among-group variation, there are 4 degrees freedom. In determining the within-group variation, there are 20 degrees of degrees of freedom. Also, note that SSA 96, SsW 120, SST = 216, MSA 24. MSW 6, and FSTAT 4. Complete parts (a) through (d). Click here to view page 1 of the...
Show work if possible please
An experiment has a single factor with five groups and five values in each group. freedom. In determining the total variation, there are: determining the among-group variation, there are 4 degrees freedom. In determining the within-group variation, there are 20 degrees of degrees of freedom. Also, note that SSA 96, SsW 120, SST = 216, MSA 24. MSW 6, and FSTAT 4. Complete parts (a) through (d). Click here to view page 1 of the...
 REGRESSION 2 • reg bught cigs faminc male Source SS df MS = = Model Residual 20477.12 554134.6 3 6825.70666 1,384 400.386272 Number of obs F(3, 1384) Prob > R-squared Adj R-squared Root MSE 1,388 17.05 0.0000 0.0356 0.0335 20.01 - Total 574611.72 1,387 414.283864 bwght Coef. Std. Err. Piti (95Conf. Intervall cigs famine male _cons -.4610457 0913378 .09687980291453 3.113968 1.076396 115.2277 1.20788 -5.050.000 3.32 0.001 2.89 0.004 95.400.000 -.6402212 .0397062 1.002423 112.8582 - 2818702 .1540535 5.225513 117.5972 f) Conduct...
 1. Two manufacturing processes are being compared to try to reduce the number of defective products made. During 8 shifts for each process, the following results were observed: Line A Line B n 181 | 187 Based on a 5% significance level, did line B have a larger average than line A? *Use the tables I gave you in the handouts for the critical values *Use the appropriate test statistic value, NOT the p-value method *Use and show the 5...
 Gain (V/V) R Setting Totals Averages Sample 1 Sample 2 Sample 3 4 ап 7.8 8.1 7.9 3 5.2 6.0 4.3 = 359.3 i=1 j=1 2 4.4 6.9 3.8 1 2.0 1.7 0.8 This is actual data from one of Joe Tritschler's audio engineering experiments. Use Analysis of Variance (ANOVA) to test the null hypothesis that the treatment means are equal at the a = 0.05 level of significance. Fill in the ANOVA table. Source of Variation Sum of Squares...
 Gain (V/V) R Setting Totals Averages Sample 1 Sample 2 Sample 3 4 ап 7.8 8.1 7.9 3 5.2 6.0 4.3 = 359.3 i=1 j=1 2 4.4 6.9 3.8 1 2.0 1.7 0.8 This is actual data from one of Joe Tritschler's audio engineering experiments. Use Analysis of Variance (ANOVA) to test the null hypothesis that the treatment means are equal at the a = 0.05 level of significance. Fill in the ANOVA table. Source of Variation Sum of Squares...
 Suppose 1000 coins are tossed. Use the normal curve approximation to the binomial distribution to find the probability of getting the following result. Exactly 495 heads Use the table of areas under the standard normal curve given below. Click here to view page 1. Click here to view page 2. Click here to view page 3. Click here to view page 4. Click here to view page 5. Click here to view page 6. The probability of getting exactly 495...
 Suppose 16 coins are tossed. Use the normal curve approximation to the binomial distribution to find the probability of getting the following result. More than 11 tails. Use the table of areas under the standard normal curve given below. Click here to view page 1. Click here to view page 2. Click here to view page 3. Click here to view page 4. Click here to view page 5. Click here to view page 6. Binomial probability = (Round to...
 I ONLY NEED HELP WITH PART OF PART "B"
I've figured out the test statistic is -1.73 and the degrees of
freedom are 5. However, I'm having a hard time finding the P value
via the chart (which I'm required to learn how to do).I think the
chart immediately bellow this is the one used to find the p-value.
However, I know at least one (or more) of the charts bellow is
what's used. Please let me know which chart...
I ONLY NEED HELP WITH PART OF PART "B"
I've figured out the test statistic is -1.73 and the degrees of
freedom are 5. However, I'm having a hard time finding the P value
via the chart (which I'm required to learn how to do).I think the
chart immediately bellow this is the one used to find the p-value.
However, I know at least one (or more) of the charts bellow is
what's used. Please let me know which chart...
Most questions answered within 3 hours.
-
The enthalpy change, ΔH, for a reaction at constant pressure is
defined as:
ΔH = ΔE...
asked 27 seconds from now -
What are the two main reasons for including covariates in ANOVA?
a. 1.) To increase within-group...
asked 1 second ago -
There are balls numbered 1, 2, 3, 4, 5, 6, 7 in a box, 2 balls...
asked 1 hour ago -
Based on the mutual fund NAVs below, how many shares will $600
buy you, if you...
asked 57 minutes ago -
what effect on total protein concentration would you
expect to see during dehydration? explain your reasoning.
asked 1 hour ago -
You are the operations manager of a firm that uses the
continuous review inventory control system....
asked 4 hours ago -
Cost and fair value data for the trading debt securities of
Wildhorse Company at December 31,...
asked 6 hours ago -
In a population of jaguars, a gene with two alleles encodes the
fur color. Allele B...
asked 7 hours ago -
Two copper wires, one 1.80 times the diameter of the other, have
the same current flowing...
asked 7 hours ago -
9. In 2003 the price of ‘home heating oil’ substantially
increased during the harsh winter. In...
asked 7 hours ago -
Match the key paradoxes of negotiation.
Claiming Value
Sticking by your principles
Sticking with your strategy...
asked 8 hours ago -
Question text Suppose a sample of 28 observations is taken from
a population, and the sample...
asked 9 hours ago