Need helping figuring out part B of the problem.

Homework Answers
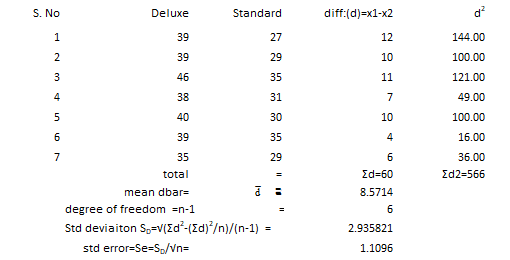
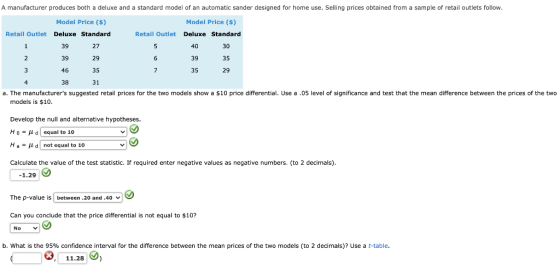
| for 95% CI; and 6 degree of freedom, value of t= | 2.447 | ||
| therefore confidence interval=sample mean -/+ t*std error | |||
| margin of errror =t*std error= | 2.7153 | ||
| lower confidence limit = | 5.86 | ||
| upper confidence limit = | 11.29 | ||
from above 95% confidence interval =(5.86 ,11.29)
(please try 5.85 ,11.28 if this comes wrong)
Add Answer to:
Need helping figuring out part B of the problem.
A manufacturer produces both a deluxe and...
I ONLY NEED HELP WITH PART OF PART "B" I've figured out the test statistic is...
 I ONLY NEED HELP WITH PART OF PART "B"
I've figured out the test statistic is -1.73 and the degrees of
freedom are 5. However, I'm having a hard time finding the P value
via the chart (which I'm required to learn how to do).I think the
chart immediately bellow this is the one used to find the p-value.
However, I know at least one (or more) of the charts bellow is
what's used. Please let me know which chart...
I ONLY NEED HELP WITH PART OF PART "B"
I've figured out the test statistic is -1.73 and the degrees of
freedom are 5. However, I'm having a hard time finding the P value
via the chart (which I'm required to learn how to do).I think the
chart immediately bellow this is the one used to find the p-value.
However, I know at least one (or more) of the charts bellow is
what's used. Please let me know which chart...
I ONLY NEED HELP WITH PART OF PART "B" I've figured out the test statistic is -1.73 and the degr...
 I ONLY NEED HELP WITH PART OF PART "B"
I've figured out the test statistic is -1.73 and the degrees of
freedom are 5. However, I'm having a hard time finding the P value
via the chart (which I'm required to learn how to do).I think the
chart immediately bellow this is the one used to find the p-value.
However, I know at least one (or more) of the charts bellow is
what's used. Please let me know which chart...
I ONLY NEED HELP WITH PART OF PART "B"
I've figured out the test statistic is -1.73 and the degrees of
freedom are 5. However, I'm having a hard time finding the P value
via the chart (which I'm required to learn how to do).I think the
chart immediately bellow this is the one used to find the p-value.
However, I know at least one (or more) of the charts bellow is
what's used. Please let me know which chart...
Most questions answered within 3 hours.
-
QUESTION 6
Determine the linear momentum of a 2,800 kg houseboat going 3
m/s.
9,100 kg.m/s...
asked 3 minutes ago -
Draw the Lewis dot structures for the following molecules. None
of the atoms have a formal...
asked 9 minutes ago -
Question 5
What effect would a decrease in
temperature have on pressure, assuming that volume
(T)...
asked 4 minutes ago -
Jor-el throws a ball upward from the top of a 728 foot building
on the planet...
asked 7 minutes ago -
What does it mean when an element is radioactive?
a.
It means the element is changing...
asked 9 minutes ago -
A company deposits $6,000 in a bank at the end of every year for
10 years....
asked 9 minutes ago -
What are some strategies for eliminating service barriers?
By using your knowledge of
behavioral styles, please...
asked 17 minutes ago -
What are the decimal numbers for 159, 150, 200, 113, 225, 87,
106, 81 when converted...
asked 25 minutes ago -
Calculate and plot the number and weight distributions of x-mers
found in a step-growth polymerization for...
asked 45 minutes ago -
The Baily Corporation has developed a specialized software
program that improves inventory control capability. The following...
asked 48 minutes ago -
Problem 5-4A (Part Level Submission) Wolford Department Store is
located in midtown Metropolis. During the past...
asked 49 minutes ago -
Preparation of Benzoic Acid using a Grignard Reagent URGENT
1. During your Grignard formation, a small...
asked 1 hour ago