
Homework Answers

Add Answer to:
1) Someone you know claims that the average earnings of all waiters in the United States...
2) Someone you know claims that the average Uber driver makes $4/hour. Let Y be a...
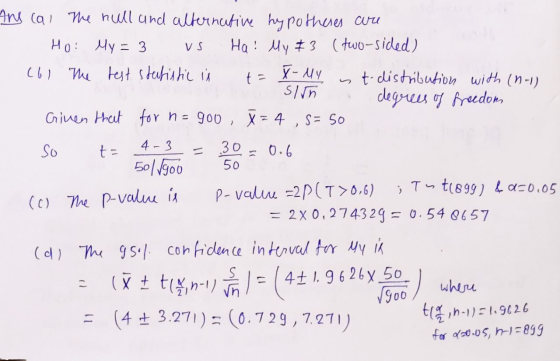
 2) Someone you know claims that the average Uber driver makes $4/hour. Let Y be a random variable equal to the hourly earnings of an Uber driver in the U.S. You wish to gather evidence (collect a sample of data) and test the null hypothesis that the average hourly earnings of all Uber drivers in the United States (Hy) is equal to $4 against the alternative hypothesis that it is not equal to $4. Suppose you collect a sample of...
According to the U.S. Bureau of Labor Statistics, the average weekly earnings of a production worker...
According to the U.S. Bureau of Labor Statistics, the average weekly earnings of a production worker in July 2011 were $657.49. Suppose a labor researcher wants to test to determine whether this figure is still accurate today. The researcher randomly selects 52 production workers from across the United States and obtains a representative earnings statement for one week from each. The resulting sample average is $671.11. Assuming a population standard deviation of $63.90 and a 10% level of significance, determine...
3) Suppose you are an educational researcher who wishes to examine the effect of a school...
 3) Suppose you are an educational researcher who wishes to examine the effect of a school district's class size on its student achievement. Specifically, you are interested in whether in the U.S., on average, school districts with smaller class sizes perform differently on test scores than school districts with larger class sizes. To test this, you have conducted two surveys. The first survey randomly sampled 238 school districts with small class sizes. This survey found a sample average test score...
Determine if there is sufficient evidence to conclude the average amount of divorces is less than...
Determine if there is sufficient evidence to conclude the average amount of divorces is less than or equal to 4000 in the United States and territories at the 0.10 level of significance. Summary Table for Divorces AVERAGE 1,487 MEDIAN 1,118 STANDARD DEVIATION 1528.92805 MAX 7,627 MIN 71 Clearly state a null and alternative hypothesis Give the value of the test statistic n=52 Report the P-Value Clearly state your conclusion (Reject the Null or Fail to Reject the Null) Explain what...
The United States government claims DUI arrests average 22,096 per state per year. A sample of...
The United States government claims DUI arrests average 22,096 per state per year. A sample of size n=10 states finds the mean to be 44,002. If DUI arrests are normally distributed with a standard deviation of 28,584. Develop null and alternative hypothesis that will help deciding whether DUI arrests are higher than government claims at the 1% significance level and calculate the p value
The average annual miles driven per vehicle in the United States is 11.1 thousand miles, with...
The average annual miles driven per vehicle in the United States is 11.1 thousand miles, with σ ≈ 600 miles. Suppose that a random sample of 41 vehicles owned by residents of Chicago showed that the average mileage driven last year was 10.9 thousand miles. Does this indicate that the average miles driven per vehicle in Chicago is different from (higher or lower than) the national average? Use a 0.05 level of significance. What are we testing in this problem?...
The United States government claims DUI arrests average 32,096 per state per year. A sample of...
The United States government claims DUI arrests average 32,096 per state per year. A sample of size n=20 states finds the mean to be 44,002. If DUI arrests are normally distributed with a standard deviation of 28,584. Develop null and alternative hypothesis that will help deciding whether DUI arrests are higher than government claims at the 1% significance level and calculate the p value? Question 18 options: 0.0390 0.0008 0.2345 0.3546
The United States government claims DUI arrests average 22084 per state per year. A sample of...
The United States government claims DUI arrests average 22084 per state per year. A sample of size n=10 states finds the mean to be 44002. If DUI arrests are normally distributed with a standard deviation of 28,584. Select the most appropriate null and alternative hypothesis that will help deciding whether DUI arrests are differ than government claims. H0 = 44002, Ha ≠ 44002 H0 = 44002 , Ha ≠ 44002 H0 = 22084 , Ha ≠ 22084 H0 = 22084...
Question: Hypothesis Testing test the following: Hypothesis Testing test the following: Determine if there is sufficient...
Question: Hypothesis Testing test the following: Hypothesis Testing test the following: Determine if there is sufficient evidence to conclude the average amount of births is over 8000 in the United States and territories at the 0.05 level of significance. Sample Size is 52 (states and US territories) Mean: 6,869 Median: 6,869 Standard Deviation: 8,100 Minimum: 569 Maximum : 45,805 Clearly state a null and alternative hypothesis. Give the value of the test statistic. Report the P-Value. Clearly state your conclusion...
 2) Someone you know claims that the average Uber driver makes $4/hour. Let Y be a random variable equal to the hourly earnings of an Uber driver in the U.S. You wish to gather evidence (collect a sample of data) and test the null hypothesis that the average hourly earnings of all Uber drivers in the United States (Hy) is equal to $4 against the alternative hypothesis that it is not equal to $4. Suppose you collect a sample of...
 3) Suppose you are an educational researcher who wishes to examine the effect of a school district's class size on its student achievement. Specifically, you are interested in whether in the U.S., on average, school districts with smaller class sizes perform differently on test scores than school districts with larger class sizes. To test this, you have conducted two surveys. The first survey randomly sampled 238 school districts with small class sizes. This survey found a sample average test score...
Most questions answered within 3 hours.
-
Write a program to score the paper-rock-scissor game. Each of
two users types in either P,R...
asked 14 minutes ago -
Calculate the equillibrium constent K for a redox reaction that
has E°cell = -.98 V at...
asked 27 minutes ago -
A concave spherical mirror has a radius of curvature of
magnitude 19.6 cm.
(a) Find the...
asked 28 minutes ago -
3. draw a diagram of the magnetic field:
a. around a long straight wire with a...
asked 27 minutes ago -
If you titrated 30.0 mL of 0.1 M HCl with 0.1 M NaOH, indicate
the approximate...
asked 35 minutes ago -
NADH passes electrons into the electron transport chain. List
the carriers that would receive the electrons,...
asked 44 minutes ago -
A cylindrical cable with a resistivity of 1.6x10⁻⁸ Ω·m and cross
sectional area of 3x10⁻⁵ m^2...
asked 43 minutes ago -
True or False.
A consumer with convex preferences who is indifferent between
the bundles (5,2) and...
asked 47 minutes ago -
A diamond's index of refraction for red light, 656 nm, is 2.410,
while that for blue...
asked 1 hour ago -
Compare HPLC, SPE, and GC. Identify the differences, the
advantages, and the weaknesses of each method.
asked 1 hour ago -
Characteristic x-rays emitted by potassium have a wavelength of
0.374 nm. What is the energy of...
asked 1 hour ago -
there is a function to create two random numbers between 1 and
25 and a function...
asked 1 hour ago