
Homework Answers
The predicted linear regression line using OLS method would come out to be =
y^= b0+b1*X
Hence, the graph of predicted values against x would be a linear trendline with b0 as the intercept on the y axis and b1 as the (upward/downward) slope of the trend line.
 This
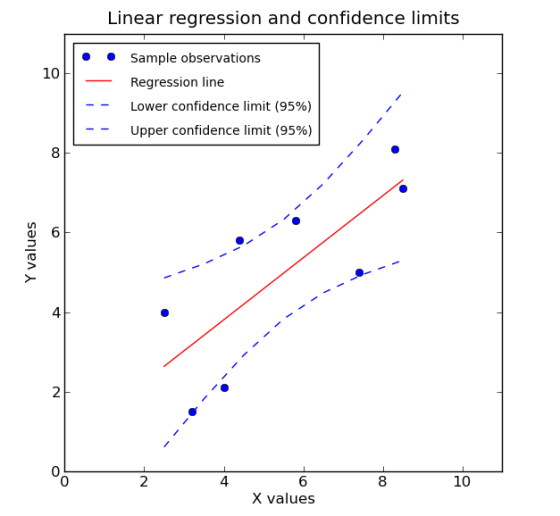
here is an example of an upward sloping linear regression line with
x axis representing x variable, y representing the predcted values.
The dots represent actual data points and the red line is the
fitted regression line with an intercept (b0)=5.
This
here is an example of an upward sloping linear regression line with
x axis representing x variable, y representing the predcted values.
The dots represent actual data points and the red line is the
fitted regression line with an intercept (b0)=5.
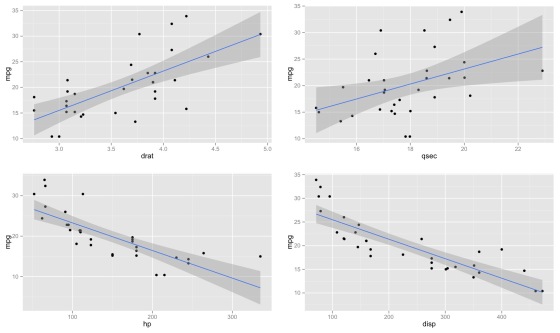
The confidence interval for predicted values in an linear regression tends to be narrow around the mean of the predictor and fat around the minimum and maximum values of the predictor. This can be seen in plots of these 4 linear regressions:
Add Answer to:
4. Consider estimation of the simple regression model: y = 30+8121+w. Show a graph of the...
Decide (with short explanations) whether the following statements are true or false. e) In a simple linear regression model with explanatory variable x and outcome variable y, we have these summary s...
 Decide (with short explanations) whether the following
statements are true or false.
e) In a simple linear regression model with explanatory variable x and outcome variable y, we have these summary statisties z-10, s/-3 sy-5 and у-20. For a new data point with x = 13, it is possible that the predicted value is y = 26. f A standard multiple regression model with continuous predictors and r2, a categorical predictor T with four values, an interaction between a and...
Decide (with short explanations) whether the following
statements are true or false.
e) In a simple linear regression model with explanatory variable x and outcome variable y, we have these summary statisties z-10, s/-3 sy-5 and у-20. For a new data point with x = 13, it is possible that the predicted value is y = 26. f A standard multiple regression model with continuous predictors and r2, a categorical predictor T with four values, an interaction between a and...
1. Consider the following simple regression model: y = β0 + β1x1 + u (1) and...
1. Consider the following simple regression model: y = β0 + β1x1 + u (1) and the following multiple regression model: y = β0 + β1x1 + β2x2 + u (2), where x1 is the variable of primary interest to explain y. Which of the following statements is correct? a. When drawing ceteris paribus conclusions about how x1 affects y, with model (1), we must assume that x2, and all other factors contained in u, are uncorrelated with x1. b....
Need help with stats true or false questions Decide (with short explanations) whether the following statements are true or false a) We consider the model y-Ao +A(z) +E. Let (-0.01, 1.5) be a 95% con...
 Need help with stats true or false questions
Decide (with short explanations) whether the following statements are true or false a) We consider the model y-Ao +A(z) +E. Let (-0.01, 1.5) be a 95% confidence interval for A In this case, a t-test with significance level 1% rejects the null hypothesis Ho : A-0 against a two sided alternative. b) Complicated models with a lot of parameters are better for prediction then simple models with just a few parameters c)...
Need help with stats true or false questions
Decide (with short explanations) whether the following statements are true or false a) We consider the model y-Ao +A(z) +E. Let (-0.01, 1.5) be a 95% confidence interval for A In this case, a t-test with significance level 1% rejects the null hypothesis Ho : A-0 against a two sided alternative. b) Complicated models with a lot of parameters are better for prediction then simple models with just a few parameters c)...
please help! Following is a simple linear regression model: y = a + A + &...
 please help!
Following is a simple linear regression model: y = a + A + & The following results were obtained from some statistical software. R2 = 0.523 Syx (regression standard error) = 3.028 n (total observations) = 41 Significance level = 0.05 = 5% Variable Interecpt Slope of X Parameter Estimate 0.519 -0.707 Std. Err. of Parameter Est 0.132 0.239 Note: For all the calculated numbers, keep three decimals. Write the fitted model (5 points) 2. Make a prediction...
please help!
Following is a simple linear regression model: y = a + A + & The following results were obtained from some statistical software. R2 = 0.523 Syx (regression standard error) = 3.028 n (total observations) = 41 Significance level = 0.05 = 5% Variable Interecpt Slope of X Parameter Estimate 0.519 -0.707 Std. Err. of Parameter Est 0.132 0.239 Note: For all the calculated numbers, keep three decimals. Write the fitted model (5 points) 2. Make a prediction...
5. Using the estimated regression equation for estimation and prediction Aa Aa Market model is a term used in finance to describe a linear regression model in which the dependent variable is the retu...
 5. Using the estimated regression equation for estimation and prediction Aa Aa Market model is a term used in finance to describe a linear regression model in which the dependent variable is the return on a stock and the independent variable is the return on the overall market. The market model is sometimes extended to include other independent variables-for example, the return on a specific industry sector. Company A is one of the leading software companies in the world. Suppose...
Consider the following simple linear regression model: y=Po+P1x Po and B1 are Multiple Choice 41 the...
 Consider the following simple linear regression model: y=Po+P1x Po and B1 are Multiple Choice 41 the response variables the random error terms the unknown parameters the explanatory variables 11 of 30 Prev Next
Question 4 (15p): Nonlinear estimation a. In a nonlinear BoBiXi+B2X?+ b. Consider the model Y =...
 Question 4 (15p): Nonlinear estimation a. In a nonlinear BoBiXi+B2X?+ b. Consider the model Y = AK"Lb. How can this model be estimated consistently given data Y.Ki c. How can we detect nonlinearities in Stata using regressions or plots? How can a study of residuals r regression Y,-A +AX + β2x? + th, how do we interpret the coefficients? What is the marginal effect of an increase in X,? and L,? indicate nonlinearities? Show if possible using relevant formulas.
Question 4 3 pts Consider the estimated multiple regression model using OLS, with the standard errors...
 Question 4 3 pts Consider the estimated multiple regression model using OLS, with the standard errors in parentheses below each estimated coefficient. There are 1,576 observations in the sample: Y = 10 + 2X2i - 5Xzi (3) (1.5) (2) Suppose that the sample mean of Y is 30. For the 18th observation (i=18) in the sample, the value of X2 is 50, the value of X3 is 16, and the value of Y is 20. The residual associated with the...
3.7 In a simple regression model, y-, + Ax + u , which of the following...
 3.7 In a simple regression model, y-, + Ax + u , which of the following is NOT referring to y? (a) Dependent variable (b) Explained variable (c) Predicted variable (d) Regressant (e) All of the above refer to y 3.8 Which of the following statements is correct? (a) If X and Y are independent, then E[YIX]- E[Y (b) If Xand Y are independent, then ElYx] (c) If Xand Y are independent, then E[Y|X] is irrelevant from E[Y] (d) None...
 Decide (with short explanations) whether the following
statements are true or false.
e) In a simple linear regression model with explanatory variable x and outcome variable y, we have these summary statisties z-10, s/-3 sy-5 and у-20. For a new data point with x = 13, it is possible that the predicted value is y = 26. f A standard multiple regression model with continuous predictors and r2, a categorical predictor T with four values, an interaction between a and...
Decide (with short explanations) whether the following
statements are true or false.
e) In a simple linear regression model with explanatory variable x and outcome variable y, we have these summary statisties z-10, s/-3 sy-5 and у-20. For a new data point with x = 13, it is possible that the predicted value is y = 26. f A standard multiple regression model with continuous predictors and r2, a categorical predictor T with four values, an interaction between a and...
 Need help with stats true or false questions
Decide (with short explanations) whether the following statements are true or false a) We consider the model y-Ao +A(z) +E. Let (-0.01, 1.5) be a 95% confidence interval for A In this case, a t-test with significance level 1% rejects the null hypothesis Ho : A-0 against a two sided alternative. b) Complicated models with a lot of parameters are better for prediction then simple models with just a few parameters c)...
Need help with stats true or false questions
Decide (with short explanations) whether the following statements are true or false a) We consider the model y-Ao +A(z) +E. Let (-0.01, 1.5) be a 95% confidence interval for A In this case, a t-test with significance level 1% rejects the null hypothesis Ho : A-0 against a two sided alternative. b) Complicated models with a lot of parameters are better for prediction then simple models with just a few parameters c)...
 please help!
Following is a simple linear regression model: y = a + A + & The following results were obtained from some statistical software. R2 = 0.523 Syx (regression standard error) = 3.028 n (total observations) = 41 Significance level = 0.05 = 5% Variable Interecpt Slope of X Parameter Estimate 0.519 -0.707 Std. Err. of Parameter Est 0.132 0.239 Note: For all the calculated numbers, keep three decimals. Write the fitted model (5 points) 2. Make a prediction...
please help!
Following is a simple linear regression model: y = a + A + & The following results were obtained from some statistical software. R2 = 0.523 Syx (regression standard error) = 3.028 n (total observations) = 41 Significance level = 0.05 = 5% Variable Interecpt Slope of X Parameter Estimate 0.519 -0.707 Std. Err. of Parameter Est 0.132 0.239 Note: For all the calculated numbers, keep three decimals. Write the fitted model (5 points) 2. Make a prediction...
 5. Using the estimated regression equation for estimation and prediction Aa Aa Market model is a term used in finance to describe a linear regression model in which the dependent variable is the return on a stock and the independent variable is the return on the overall market. The market model is sometimes extended to include other independent variables-for example, the return on a specific industry sector. Company A is one of the leading software companies in the world. Suppose...
 Consider the following simple linear regression model: y=Po+P1x Po and B1 are Multiple Choice 41 the response variables the random error terms the unknown parameters the explanatory variables 11 of 30 Prev Next
 Question 4 (15p): Nonlinear estimation a. In a nonlinear BoBiXi+B2X?+ b. Consider the model Y = AK"Lb. How can this model be estimated consistently given data Y.Ki c. How can we detect nonlinearities in Stata using regressions or plots? How can a study of residuals r regression Y,-A +AX + β2x? + th, how do we interpret the coefficients? What is the marginal effect of an increase in X,? and L,? indicate nonlinearities? Show if possible using relevant formulas.
 Question 4 3 pts Consider the estimated multiple regression model using OLS, with the standard errors in parentheses below each estimated coefficient. There are 1,576 observations in the sample: Y = 10 + 2X2i - 5Xzi (3) (1.5) (2) Suppose that the sample mean of Y is 30. For the 18th observation (i=18) in the sample, the value of X2 is 50, the value of X3 is 16, and the value of Y is 20. The residual associated with the...
 3.7 In a simple regression model, y-, + Ax + u , which of the following is NOT referring to y? (a) Dependent variable (b) Explained variable (c) Predicted variable (d) Regressant (e) All of the above refer to y 3.8 Which of the following statements is correct? (a) If X and Y are independent, then E[YIX]- E[Y (b) If Xand Y are independent, then ElYx] (c) If Xand Y are independent, then E[Y|X] is irrelevant from E[Y] (d) None...
Most questions answered within 3 hours.
-
You purchase your daily coffee at the Chemist’s Coffeehouse and
have a choice of two cups:...
asked 1 hour ago -
Which of the following pairs of chemicals could be used to make
a buffer solution?
A.)...
asked 1 hour ago -
Problem 16-51 Sales
Activity Variance (LO 16-3)Odessa, Inc., reports the following
information concerning operations for the...
asked 2 hours ago -
Pictured on the right are thee point charges Q1 = 18.4 μC, Q2 =
-30.6 μC,...
asked 2 hours ago -
A graduate student is conducting research in psychology and
needs to obtain the IQ scores of...
asked 2 hours ago -
R2.84: There are 2 defective products in a production lot of 10.
An inspector randomly selected...
asked 4 hours ago -
Consider the following equilibrium system: COCl2(g) CO(g) +
Cl2(g) A 10.00 L evacuated flask is filled...
asked 4 hours ago -
1) What are the two distinct steps that one needs to perform
when developing a data...
asked 4 hours ago -
2) Write a C++ program that uses a class called “Degree” to
obtain the trigonometric
values...
asked 5 hours ago -
1. In eukaryotic cells the genomes of
&
asked 5 hours ago -
The standard enthalpy of propanol (C3H7OH) is -303.0 kJ/mol.
Compute both of the
gross and net...
asked 5 hours ago -
Why PWM using H-bridge for control motor speed is more power
effiecient than the linear amplifier...
asked 6 hours ago