 b. What is the equation of the regression
line for the set of points?
b. What is the equation of the regression
line for the set of points?
 The best predicted weight for a bear with a
chest size of 48 inches is .......nothing pounds.
The best predicted weight for a bear with a
chest size of 48 inches is .......nothing pounds.
 The best predicted temperature when a bug
is chirping at 3000 chirps per minute is .........F.
The best predicted temperature when a bug
is chirping at 3000 chirps per minute is .........F.
Homework Answers
1)
| ΣX | ΣY | Σ(x-x̅)² | Σ(y-ȳ)² | Σ(x-x̅)(y-ȳ) | |
| total sum | 110.00 | 135.32 | 110.00 | 137.0 | 110.00 |
| mean | 10.00 | 12.30 | SSxx | SSyy | SSxy |
Sample size, n = 11
here, x̅ = Σx / n= 10.000
ȳ = Σy/n = 12.302
SSxx = Σ(x-x̅)² = 110.0000
SSxy= Σ(x-x̅)(y-ȳ) = 110.0
estimated slope , ß1 = SSxy/SSxx = 110/110=
1.0000
intercept,ß0 = y̅-ß1* x̄ = 12.3018- (1
)*10= 2.3018
Regression line is, Ŷ= 2.30 + (
1.00 )*x
==============================
2)
using all ten points
a)
| ΣX | ΣY | Σ(x-x̅)² | Σ(y-ȳ)² | Σ(x-x̅)(y-ȳ) | |
| total sum | 56.00 | 44.00 | 20.40 | 20.4 | -14.40 |
| mean | 5.60 | 4.40 | SSxx | SSyy | SSxy |
Sample size, n = 10
here, x̅ = Σx / n= 5.600
ȳ = Σy/n = 4.400
SSxx = Σ(x-x̅)² = 20.4000
SSxy= Σ(x-x̅)(y-ȳ) = -14.4
estimated slope , ß1 = SSxy/SSxx =
-14.4/20.4= -0.7059
intercept,ß0 = y̅-ß1* x̄ = 4.4- (-0.7059
)*5.6= 8.3529
Regression line is, Ŷ= 8.353 +
( -0.706 )*x
b) after removing point (2,8)
Regression line is, Ŷ= 4.000 +
( 0.000 )*x
=======================
3)
| ΣX | ΣY | Σ(x-x̅)² | Σ(y-ȳ)² | Σ(x-x̅)(y-ȳ) | |
| total sum | 311.00 | 1724.00 | 222.83 | 24591.3 | 2282.33 |
| mean | 51.83 | 287.33 | SSxx | SSyy | SSxy |
Sample size, n = 6
here, x̅ = Σx / n= 51.833
ȳ = Σy/n = 287.333
SSxx = Σ(x-x̅)² = 222.8333
SSxy= Σ(x-x̅)(y-ȳ) = 2282.3
estimated slope , ß1 = SSxy/SSxx =
2282.3333/222.8333= 10.2423
intercept,ß0 = y̅-ß1* x̄ = 287.3333- (10.2423
)*51.8333= -243.5610
Regression line is, Ŷ= -243.6 + (
10.2 )*x
Predicted Y at X= 48
is
Ŷ= -243.56096 +
10.24233 *48= 248.1
========================
4)
| ΣX | ΣY | Σ(x-x̅)² | Σ(y-ȳ)² | Σ(x-x̅)(y-ȳ) | |
| total sum | 5615.00 | 462.90 | 132398.83 | 671.4 | 9082.75 |
| mean | 935.83 | 77.15 | SSxx | SSyy | SSxy |
Sample size, n = 6
here, x̅ = Σx / n= 935.833
ȳ = Σy/n = 77.150
SSxx = Σ(x-x̅)² = 132398.8333
SSxy= Σ(x-x̅)(y-ȳ) = 9082.8
estimated slope , ß1 = SSxy/SSxx =
9082.75/132398.8333= 0.0686
intercept,ß0 = y̅-ß1* x̄ = 77.15- (0.0686
)*935.8333= 12.9505
Regression line is, Ŷ= 12.95 + (
0.0686 )*x
Add Answer to:
b. What is the equation of the regression
line for the set of points?
The best...
1. 2. 3. Use the given data to find the equation of the regression line. Examine...
 1.
2.
3.
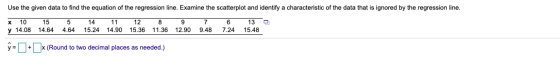
Use the given data to find the equation of the regression line. Examine the scatterplot and identify a characteristic of the data that is ignored by the regression line. X 5 14 13.31 13 13.66 12 13.74 10 13.05 9 12.30 4 4.31 6 8.34 8 11.25 11 13.54 7 9.94 y 6.46 = 3.00 + 0.80 (Round to two decimal places as needed.) The data show the chest size and weight of several bears. Find the...
1.
2.
3.
Use the given data to find the equation of the regression line. Examine the scatterplot and identify a characteristic of the data that is ignored by the regression line. X 5 14 13.31 13 13.66 12 13.74 10 13.05 9 12.30 4 4.31 6 8.34 8 11.25 11 13.54 7 9.94 y 6.46 = 3.00 + 0.80 (Round to two decimal places as needed.) The data show the chest size and weight of several bears. Find the...
The data show the bug chirps per minute at different temperatures. Find the regression equation, letting...
 The data show the bug chirps per minute at different temperatures. Find the regression equation, letting the first variable be the independent (x) variable. Find the best predicted temperature for a time when a bug is chirping at the rate of 3000 chirps per minute. Use a significance level of 0.05. What is wrong with this predicted value? Chirps in 1 min Temperature (F) 894 965 83 856 949 1233 69.9 81 74.3 77 75 88.3 What is the regression...
The data show the bug chirps per minute at different temperatures. Find the regression equation, letting...
 The data show the bug chirps per minute at different temperatures. Find the regression equation, letting the first variable be the independent (x) variable. Find the best predicted temperature for a time when a bug is chirping at the rate of 3000 chirps per minute. Use a significance level of 0.05. What is wrong with this predicted value? Chirps in 1 min 939 1172 961 983 1213 1012 Temperature (°F) 77.6 91 74.7 81.7 92.478.1 What is the regression equation?...
SHOW ALL WORK THROUGH MINITAB ANSWER THE FOLLOWING: 1.What is the regression equation? 2.What is the...
 SHOW ALL WORK THROUGH MINITAB
ANSWER THE FOLLOWING:
1.What is the regression equation?
2.What is the best predicted temperature for a time when a bug
is chirping at the rate of 3000 chirps per minute?
The best predicted temperature when a bug is chirping at 3000
chirps per minute is ______
The data show the bug chirps per minute at different temperatures. Find the regression equation, letting the first variable be the independent (x) variable. Find the best predicted temperature...
SHOW ALL WORK THROUGH MINITAB
ANSWER THE FOLLOWING:
1.What is the regression equation?
2.What is the best predicted temperature for a time when a bug
is chirping at the rate of 3000 chirps per minute?
The best predicted temperature when a bug is chirping at 3000
chirps per minute is ______
The data show the bug chirps per minute at different temperatures. Find the regression equation, letting the first variable be the independent (x) variable. Find the best predicted temperature...
8. The data show the chest size and weight of several bears. Find the regression equation,...
8. The data show the chest size and weight of several bears. Find the regression equation, letting chest size be the independent (x) variable. Then find the best predicted weight of a bear with a chest size of 40 inches. Is the result close to the actual weight of 392 pounds? Use a significance level of 0.05. Chest_size_(inches) Weight_ (pounds) 41 328 54 528 44 418 55 580 39 296 51 503 What is the regression equation? Ŷ=____+____x (Round to...
1) 2) The data show the chest size and weight of several bears. Find the regression...
 1)
2)
The data show the chest size and weight of several bears. Find the regression equation, letting chest size be the independent (x) variable. Then find the best predicted weight of a bear with a chest size of 58 inches. Is the result close to the actual weight of 632 pounds? Use a significance level of 0.05. Chest size (inches) 46 57 53 41 Weight (pounds) 384 580 542 358 306 320 Click the icon to view the critical...
1)
2)
The data show the chest size and weight of several bears. Find the regression equation, letting chest size be the independent (x) variable. Then find the best predicted weight of a bear with a chest size of 58 inches. Is the result close to the actual weight of 632 pounds? Use a significance level of 0.05. Chest size (inches) 46 57 53 41 Weight (pounds) 384 580 542 358 306 320 Click the icon to view the critical...
Question Hep The data show the bug chirps per minute at different temperatures Find the regression...
 Question Hep The data show the bug chirps per minute at different temperatures Find the regression equation letting the first variable be the independent [) variable Find the best predicted temperature for a time when a bug is chirping at the rate of 3000 chirps per minute Use a sigrificance level of 0.05 What is wrong with this predicted value? 1m7F) +005 1020부 1193 1243 995 1070 904 1193 1247 1075 p 81 82 73 872 883 843 Temperature (...
10.2.22 : Question Help The data show the bug chirps per minute at different temperatures. Find...
 10.2.22 : Question Help The data show the bug chirps per minute at different temperatures. Find the regression equation, letting the first variable be the independent (x) variable. Find the best predicted temperature for a time when a bug is chirping at the rate of 3000 chirps per minute. Use a significance level of 0.05. What is wrong with this predicted value? Chirps in 1 min 1240 1195 928 809 932 763 Temperature (°F) 95.2 85.5 77.5 67.8 72.5 66.7...
1. 2. The data show the bug chirps per minute at different temperatures. Find the regression...
 1.
2.
The data show the bug chirps per minute at different temperatures. Find the regression equation, letting the first variable be the independent (x) variable. Find the best predicted temperature for a time when a bug is chirping at the rate of 3000 chirps per minute. Use a significance level of 0.05. What is wrong with this predicted value? Chirps in 1 min 1088 835 1239 1075 1212 917 Temperature (°F) 80.9 73.4 88.5 87.3 91.4 77.7 What is...
1.
2.
The data show the bug chirps per minute at different temperatures. Find the regression equation, letting the first variable be the independent (x) variable. Find the best predicted temperature for a time when a bug is chirping at the rate of 3000 chirps per minute. Use a significance level of 0.05. What is wrong with this predicted value? Chirps in 1 min 1088 835 1239 1075 1212 917 Temperature (°F) 80.9 73.4 88.5 87.3 91.4 77.7 What is...
not ho chi The data show the chest size and weight of several bears. Find the...
 not ho chi The data show the chest size and weight of several bears. Find the regression equation, letting chest size be the independent (x) variable. Then find the best predicted weight of a bear with a chest size of 48 inches. Is the result close to the actual weight of 218 pounds? Use a significance level of 0.05. Chest size (inches) 58 49 58 43 46 57 Weight (pounds) 355 266 332 177 246 348 Click the icon to...
 1.
2.
3.
Use the given data to find the equation of the regression line. Examine the scatterplot and identify a characteristic of the data that is ignored by the regression line. X 5 14 13.31 13 13.66 12 13.74 10 13.05 9 12.30 4 4.31 6 8.34 8 11.25 11 13.54 7 9.94 y 6.46 = 3.00 + 0.80 (Round to two decimal places as needed.) The data show the chest size and weight of several bears. Find the...
1.
2.
3.
Use the given data to find the equation of the regression line. Examine the scatterplot and identify a characteristic of the data that is ignored by the regression line. X 5 14 13.31 13 13.66 12 13.74 10 13.05 9 12.30 4 4.31 6 8.34 8 11.25 11 13.54 7 9.94 y 6.46 = 3.00 + 0.80 (Round to two decimal places as needed.) The data show the chest size and weight of several bears. Find the...
 The data show the bug chirps per minute at different temperatures. Find the regression equation, letting the first variable be the independent (x) variable. Find the best predicted temperature for a time when a bug is chirping at the rate of 3000 chirps per minute. Use a significance level of 0.05. What is wrong with this predicted value? Chirps in 1 min Temperature (F) 894 965 83 856 949 1233 69.9 81 74.3 77 75 88.3 What is the regression...
 The data show the bug chirps per minute at different temperatures. Find the regression equation, letting the first variable be the independent (x) variable. Find the best predicted temperature for a time when a bug is chirping at the rate of 3000 chirps per minute. Use a significance level of 0.05. What is wrong with this predicted value? Chirps in 1 min 939 1172 961 983 1213 1012 Temperature (°F) 77.6 91 74.7 81.7 92.478.1 What is the regression equation?...
 SHOW ALL WORK THROUGH MINITAB
ANSWER THE FOLLOWING:
1.What is the regression equation?
2.What is the best predicted temperature for a time when a bug
is chirping at the rate of 3000 chirps per minute?
The best predicted temperature when a bug is chirping at 3000
chirps per minute is ______
The data show the bug chirps per minute at different temperatures. Find the regression equation, letting the first variable be the independent (x) variable. Find the best predicted temperature...
SHOW ALL WORK THROUGH MINITAB
ANSWER THE FOLLOWING:
1.What is the regression equation?
2.What is the best predicted temperature for a time when a bug
is chirping at the rate of 3000 chirps per minute?
The best predicted temperature when a bug is chirping at 3000
chirps per minute is ______
The data show the bug chirps per minute at different temperatures. Find the regression equation, letting the first variable be the independent (x) variable. Find the best predicted temperature...
 1)
2)
The data show the chest size and weight of several bears. Find the regression equation, letting chest size be the independent (x) variable. Then find the best predicted weight of a bear with a chest size of 58 inches. Is the result close to the actual weight of 632 pounds? Use a significance level of 0.05. Chest size (inches) 46 57 53 41 Weight (pounds) 384 580 542 358 306 320 Click the icon to view the critical...
1)
2)
The data show the chest size and weight of several bears. Find the regression equation, letting chest size be the independent (x) variable. Then find the best predicted weight of a bear with a chest size of 58 inches. Is the result close to the actual weight of 632 pounds? Use a significance level of 0.05. Chest size (inches) 46 57 53 41 Weight (pounds) 384 580 542 358 306 320 Click the icon to view the critical...
 Question Hep The data show the bug chirps per minute at different temperatures Find the regression equation letting the first variable be the independent [) variable Find the best predicted temperature for a time when a bug is chirping at the rate of 3000 chirps per minute Use a sigrificance level of 0.05 What is wrong with this predicted value? 1m7F) +005 1020부 1193 1243 995 1070 904 1193 1247 1075 p 81 82 73 872 883 843 Temperature (...
 10.2.22 : Question Help The data show the bug chirps per minute at different temperatures. Find the regression equation, letting the first variable be the independent (x) variable. Find the best predicted temperature for a time when a bug is chirping at the rate of 3000 chirps per minute. Use a significance level of 0.05. What is wrong with this predicted value? Chirps in 1 min 1240 1195 928 809 932 763 Temperature (°F) 95.2 85.5 77.5 67.8 72.5 66.7...
 1.
2.
The data show the bug chirps per minute at different temperatures. Find the regression equation, letting the first variable be the independent (x) variable. Find the best predicted temperature for a time when a bug is chirping at the rate of 3000 chirps per minute. Use a significance level of 0.05. What is wrong with this predicted value? Chirps in 1 min 1088 835 1239 1075 1212 917 Temperature (°F) 80.9 73.4 88.5 87.3 91.4 77.7 What is...
1.
2.
The data show the bug chirps per minute at different temperatures. Find the regression equation, letting the first variable be the independent (x) variable. Find the best predicted temperature for a time when a bug is chirping at the rate of 3000 chirps per minute. Use a significance level of 0.05. What is wrong with this predicted value? Chirps in 1 min 1088 835 1239 1075 1212 917 Temperature (°F) 80.9 73.4 88.5 87.3 91.4 77.7 What is...
 not ho chi The data show the chest size and weight of several bears. Find the regression equation, letting chest size be the independent (x) variable. Then find the best predicted weight of a bear with a chest size of 48 inches. Is the result close to the actual weight of 218 pounds? Use a significance level of 0.05. Chest size (inches) 58 49 58 43 46 57 Weight (pounds) 355 266 332 177 246 348 Click the icon to...
Most questions answered within 3 hours.
-
1. The catabolic Activation Protein (CAP) is a regulatory
protein associated with several carbohydrate metabolism operons...
asked 1 minute ago -
A car company was preparing their marketing materials for the
2020 version of their popular SUV....
asked 11 minutes ago -
7.13 LAB: Word frequencies (lists)
Write a program that first reads in the name of an...
asked 15 minutes ago -
how
much is the energy of co2 per mole increased when it absorbs
infrared radiation with...
asked 20 minutes ago -
which reagent CAN convert the glucose ring into a linear
chain?
a) HCl (aq)
b) H2CrO4...
asked 32 minutes ago -
USING MATLAB.
Design a program which uses a for…end loop to add 10 to
a variable...
asked 34 minutes ago -
The raft is made up of
ten 18 cm diameter logs, each with a length of...
asked 37 minutes ago -
Batteries are one of the major imports of the US from China.
Batteries cost 10 Yuan...
asked 52 minutes ago -
the
Kb of ammonia (NH3) at 25.0 C is 1.75 x 10⁻⁵. Calculate the pH of...
asked 1 hour ago -
aluminum maker Alcoa has a beta of about 1.86, whereas Hormel
Foods has a beta of...
asked 1 hour ago -
Hewtex Electronics manufactures two products, headsets and
electronic calculators, and sells them nationally to wholesalers
and...
asked 1 hour ago -
PHP
Create an HTML Form that asks for a series of
personal information from the user,...
asked 1 hour ago