Use the datafile ads2.csv. A consumer products company uses direct mail marketing for its advertising campaigns. The company has three different designs (1, 2, and 3) for a new brochure designed for customers in four regions (NE = north east, NW = north west, SE = south east, and SW = south west). The company decides to test the design types by mailing samples of each design to potential customers in each region. They repeat the direct mailing campaign 3 times for each design type and region combination and record the number of responses they receive (denoted as Response). The company wonders if the design type and region have an impact on the number of responses they get.
- What type of statistical model would you use?
- What is/are the factors? What are its/their levels?
- Formulate all the relevant null and alternative hypotheses.
- Decide whether to use a model with or without interaction term. Run the appropriate model and interpret results. What is the value of the test statistic for each hypothesis tested? What are the statistical decisions at a significance level alpha = 0.05?
- Check all model assumptions. Are the model assumptions satisfied?
- Test pairwise differences between factor levels at the significance level 0.05
- show all your work, results, figures and interpretation in the Word document. At the end of the Word document, create a section entitled “Appendix: R Syntax”, and copy and paste all the R codes you used for each question part


Homework Answers
a) There are two factors Design and Region. So we can use Two way ANOVA model.
b) Factor 1 : Disign , it has Three (3) Levels.
Factor 2 : Region, it has Three (4) Levels.
c) Null hypotheis for two factors
Ho1: There is no significant effect of designs on number of responses.
Ho2: There is no significant effect of regions on number of responses.
Alternatived hypotheis for two factors
H11: There is significant effect of designs on number of responses.
H12: There is significant effect of regions on number of responses.
d)
Data :
| Design | Region | Response |
| 1 | NE | 250 |
| 1 | NW | 350 |
| 1 | SE | 219 |
| 1 | SW | 375 |
| 1 | NE | 260 |
| 1 | NW | 345 |
| 1 | SE | 200 |
| 1 | SW | 365 |
| 1 | NE | 232 |
| 1 | NW | 320 |
| 1 | SE | 222 |
| 1 | SW | 345 |
| 2 | NE | 400 |
| 2 | NW | 525 |
| 2 | SE | 390 |
| 2 | SW | 580 |
| 2 | NE | 420 |
| 2 | NW | 512 |
| 2 | SE | 385 |
| 2 | SW | 365 |
| 2 | NE | 465 |
| 2 | NW | 510 |
| 2 | SE | 379 |
| 2 | SW | 567 |
| 3 | NE | 275 |
| 3 | NW | 340 |
| 3 | SE | 200 |
| 3 | SW | 310 |
| 3 | NE | 289 |
| 3 | NW | 335 |
| 3 | SE | 234 |
| 3 | SW | 295 |
| 3 | NE | 289 |
| 3 | NW | 327 |
| 3 | SE | 210 |
| 3 | SW | 287 |
Here we use Two way Anova without Interaction model,
summary(a)
Df Sum Sq Mean Sq F value Pr(>F)
as.factor(d[, 1]) 2 236337 118169 83.42 5.56e-13 ***
as.factor(d[, 2]) 3 94638 31546 22.27 8.80e-08 ***
Residuals 30 42495 1416
By using P-value , we reject both the null hypotheses.(since P- value is less than 0.05).
Conclusion :There is significant effect of designs on number of responses and There is significant effect of regions on number of responses.
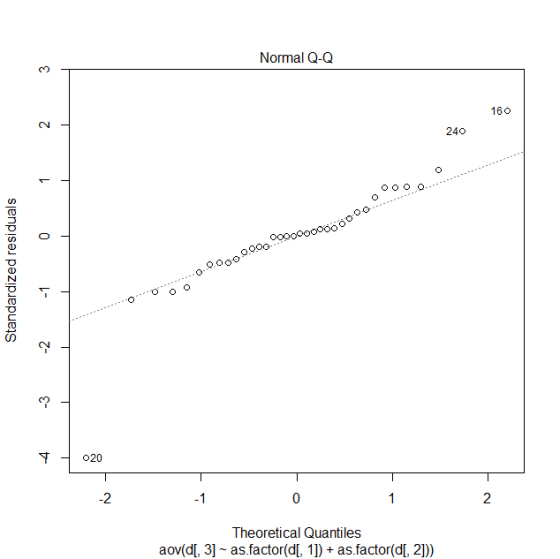
e) From this plot , we can say that residuals are normally distributed and all assumptions are met. There is no model defect.
f)
f)
Pairwise differences between factor levels at the significance level 0.05
Designs diff lwr upr p adj
2-1 167.916667 130.03784 205.79549 0.0000000 ------P- value is less
than 0.05. Therefor Design 2 and Design 1 has different effect on
responce.
3-1 -7.666667 -45.54549 30.21216 0.8723492 ------P-
value is not less than 0.05. Therefor Design 2 and
Design 1 has same effect on responce.
3-2 -175.583333 -213.46216 -137.70451 0.0000000 ------P- value is
less than 0.05. Therefor Design 2 and Design 1 has different effect
on responce.
$`as.factor(d[, 2])`
Region diff lwr upr p adj
NW-NE 76.000000 27.75772 124.2422836 0.0009529 ------P-
value is less than 0.05. Therefor Region NW and Region NE has
different effect on responce.
SE-NE -49.000000 -97.24228 -0.7577164 0.0454415 ------P- value is
less than 0.05. Therefor Region SE and Region NE has different
effect on responce.
SW-NE 67.666667 19.42438 115.9089503 0.0033716 ------P-
value is less than 0.05. Therefor Region SW and Region NE has
different effect on responce.
SE-NW -125.000000 -173.24228 -76.7577164 0.0000005 ------P- value
is less than 0.05. Therefor Region SE and Region NW has different
effect on responce.
SW-NW -8.333333 -56.57562 39.9089503 0.9651365 ------P- value is
not less than 0.05. Therefor Region SW and Region NW has same
effect on responce.
SW-SE 116.666667 68.42438 164.9089503 0.0000016
------P- value is less than 0.05. Therefor Region SW
and Region SE has different effect on responce.
g) “Appendix: R Syntax”, and copy and paste all the R codes you used for each question part :
d=data.frame(read.csv(file.choose()))
d
a=aov(d[,3]~as.factor(d[,1])+as.factor(d[,2]),data=d)
a
summary(a)
plot(a)
TukeyHSD(a)
Add Answer to:
Use the datafile ads2.csv. A consumer products
company uses direct mail marketing for its advertising campaigns....
Exercise 7.3.12 You own a trailer rental company in a large city and you have four locations, one in the South East, on...
 Exercise 7.3.12 You own a trailer rental company in a large city and you have four locations, one in the South East, one in the North East, one in the North West, and one in the South West. Denote these locations by SE,NE,NW, and SW respectively. Suppose that the following table is observed to take place. SE NE NW SW SE C NE NW SW In this table, the probability that a trailer starting at NE ends in NW is...
A. Using the Planisphere For Spring Observations Set the planisphere for February 15 at 8:00 Set...
 A. Using the Planisphere For Spring Observations Set the planisphere for February 15 at 8:00 Set the planisphere for September 15 at 9:00 For Fall Observations PM local standard time. PM local daylight saving time Spring Fall 1. Name 3 constellations on (or a. lb. 1c. near) the meridian lb 1c. 2. Name a constellation on or near the Horizon in each of the four cardinal directions (N, E, S, W) East2. North South West 2. North East South West...
guys need help please im super lost anyone save me do programming exercise top_div_array.cpp: Winning Division...
guys need help please im super lost anyone save me do programming exercise top_div_array.cpp: Winning Division app (top_div.cpp) revisited to use arrays This is the same program done last week but using and passing arrays instead of individual variables. Start with the following file / cODE BELOW: // Name: top_div_array.cpp // Description: // This app inputs sales for four regional division and displays the highest. // To accomplish this, use two arrays of equal length - one for sales and...
Okoboji Company manufactures wooden canoes, and has four operating divisions: East, West, North, and South. Each...
Okoboji Company manufactures wooden canoes, and has four operating divisions: East, West, North, and South. Each division manufactures a unique model of canoe. During the first quarter of 2017, total net operating income was $70,000. A breakdown by division was as follows: East West North South Sales $ 550,000 $750,000 $950,000 $450,000 COGS 460,000 480,000 575,000 400,000 S & A expenses 120,000 220,000 250,000 125,000 Net Op. Income $ ( 30,000) $ 50,000 $125,000 $ (75,000) An...
You are a marketing manager for a company that makes ready-to-eat breakfast cereals. Your company recently...
You are a marketing manager for a company that makes ready-to-eat breakfast cereals. Your company recently initiated a loyalty program for consumers, which resulted in a large purchaser database. The brand managers are eager to mine the available data, which they can use to design more effective promotional programs. The management of your organization believes that to be effective, these programs have to take into account significant cross-region (i.e., the East Coast, the West Coast, the Midwest, and the South)...
Profit Center Responsibility Reporting for a Service Company Thomas Railroad Company organizes its three divisions, the...
Profit Center Responsibility Reporting for a Service Company Thomas Railroad Company organizes its three divisions, the North (N), South (S), and West (W) regions, as profit centers. The chief executive officer (CEO) evaluates divisional performance, using income from operations as a percent of revenues. The following quarterly income and expense accounts were provided from the trial balance as of December 31: Revenues—N Region $988,000 Revenues—S Region 1,171,800 Revenues—W Region 2,089,500 Operating Expenses—N Region 626,100 Operating Expenses—S Region 697,400 Operating Expenses—W...
Profit Center Responsibility Reporting for a Service Company Thomas Railroad Company organizes its three divisions, the...
Profit Center Responsibility Reporting for a Service Company Thomas Railroad Company organizes its three divisions, the North (N), South (S), and West (W) regions, as profit centers. The chief executive officer (CEO) evaluates divisional performance, using income from operations as a percent of revenues. The following quarterly income and expense accounts were provided from the trial balance as of December 31: Revenues—N Region $1,163,800 Revenues—S Region 1,367,400 Revenues—W Region 2,524,700 Operating Expenses—N Region 737,500 Operating Expenses—S Region 813,800 Operating Expenses—W...
Profit Center Responsibility Reporting for a Service Company Thomas Railroad Company organizes its three divisions, the...
 Profit Center Responsibility Reporting for a Service Company Thomas Railroad Company organizes its three divisions, the North (N), South (S), and West (W) regions, as profit centers. The chief executive officer (CEO) evaluates divisional performance, using income from operations as a percent of revenues. The following quarterly income and expense accounts were provided from the trial balance as of December 31: Revenues-N Region $1,055,700 Revenues-S Region 1,248,600 Revenues-W Region 2,291,900 Operating Expenses-N Region 669,000 Operating Expenses-s Region 743,100 Operating Expenses-W...
Glassware is a high-end glass manufacturer. The company is planning to expand its sales operation to...
 Glassware is a high-end glass manufacturer. The company is planning to expand its sales operation to the European market. A supply chain analyst within the company picked five locations for potential warehouse sites. These locations are Barcelona Spain, Budapest-Hungary, Helsinki-Finland, Lyon-France, and Munich-Germany. A marketing analyst divided Europe into four general regions; East, West, South, and North. In the accompanying spreadsheet, the fixed cost of opening warehouses, the capacity of the warehouses, transportation cost from warehouses to regions, and demand...
#2 You are going to add more code to carClass.cpp. 0. Make sure you finished the...
 #2 You are going to add more code to carClass.cpp. 0. Make sure you finished the lab part: goForward, turnRight(), getDirection(), getXO, getY() and get Modelo 1. Preparation: In the last lab, we tested our functions using cl. Comment out that section. Create c2 with any make and model. int main() Car cl("Toyota", "Camry") 77777777777777 lereate c2 here Tested the functions in the last lab cout <<cl.getModel() << endl; Comment out this section cout <<cl.getX() <<"*«<cl.getY() << endl; return 0;...
 Exercise 7.3.12 You own a trailer rental company in a large city and you have four locations, one in the South East, one in the North East, one in the North West, and one in the South West. Denote these locations by SE,NE,NW, and SW respectively. Suppose that the following table is observed to take place. SE NE NW SW SE C NE NW SW In this table, the probability that a trailer starting at NE ends in NW is...
 A. Using the Planisphere For Spring Observations Set the planisphere for February 15 at 8:00 Set the planisphere for September 15 at 9:00 For Fall Observations PM local standard time. PM local daylight saving time Spring Fall 1. Name 3 constellations on (or a. lb. 1c. near) the meridian lb 1c. 2. Name a constellation on or near the Horizon in each of the four cardinal directions (N, E, S, W) East2. North South West 2. North East South West...
 Profit Center Responsibility Reporting for a Service Company Thomas Railroad Company organizes its three divisions, the North (N), South (S), and West (W) regions, as profit centers. The chief executive officer (CEO) evaluates divisional performance, using income from operations as a percent of revenues. The following quarterly income and expense accounts were provided from the trial balance as of December 31: Revenues-N Region $1,055,700 Revenues-S Region 1,248,600 Revenues-W Region 2,291,900 Operating Expenses-N Region 669,000 Operating Expenses-s Region 743,100 Operating Expenses-W...
 Glassware is a high-end glass manufacturer. The company is planning to expand its sales operation to the European market. A supply chain analyst within the company picked five locations for potential warehouse sites. These locations are Barcelona Spain, Budapest-Hungary, Helsinki-Finland, Lyon-France, and Munich-Germany. A marketing analyst divided Europe into four general regions; East, West, South, and North. In the accompanying spreadsheet, the fixed cost of opening warehouses, the capacity of the warehouses, transportation cost from warehouses to regions, and demand...
 #2 You are going to add more code to carClass.cpp. 0. Make sure you finished the lab part: goForward, turnRight(), getDirection(), getXO, getY() and get Modelo 1. Preparation: In the last lab, we tested our functions using cl. Comment out that section. Create c2 with any make and model. int main() Car cl("Toyota", "Camry") 77777777777777 lereate c2 here Tested the functions in the last lab cout <<cl.getModel() << endl; Comment out this section cout <<cl.getX() <<"*«<cl.getY() << endl; return 0;...
Most questions answered within 3 hours.
-
Principles of Programming midterm study guide help!
1.)
______ Which of the following would reference the...
asked 10 minutes ago -
Romeo wishes to throw a bouquet of flowers to Juliet, who is on
a second-story balcony,...
asked 24 minutes ago -
Why is QE a controversial monetary policy tool.
A. It may lead to excessive inflation.B. By...
asked 40 minutes ago -
A finite potential well has depth U0 = 2.78 eV . What is the
penetration distance...
asked 1 hour ago -
1. The bus bars of a power station are in two sections A and B
separated...
asked 1 hour ago -
Fiscal policy is the deliberate manipulation of taxes and
government spending to alter GDP, employment, inflation...
asked 2 hours ago -
evaluating an expression using only one digit and + and - as
operators ....3+5-1+7-5+8
-----------------------
stack...
asked 2 hours ago -
Two concentric current loops lie in the same plane. The smaller
loop has a radius of...
asked 2 hours ago -
1)Which of the following is an
important difference between qualified and nonqualified retirement
plans?
a. Qualified...
asked 2 hours ago -
What's the streaming business's problem on the
horizon?
asked 3 hours ago -
I need help with writing the conclusion for this online lab
report
Abstract
By testing the...
asked 3 hours ago -
For the reaction 1N2+3H2-----> 2NH3, would the reaction rate
trend be: delta[NH3]/ delta t = -2...
asked 4 hours ago