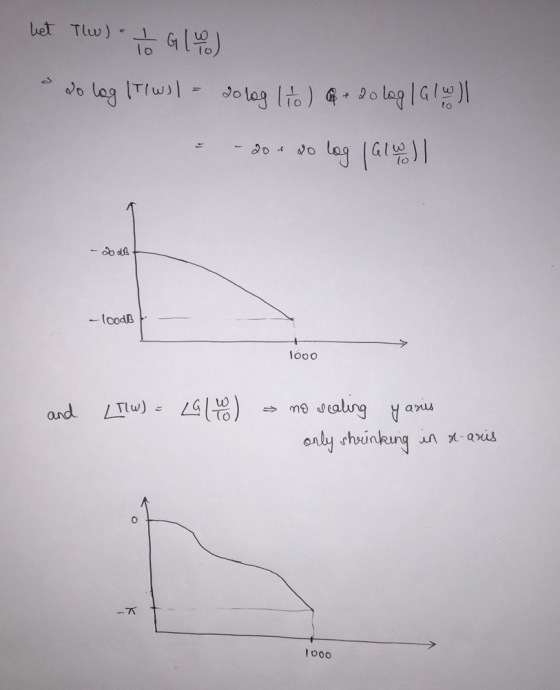
3. Let h(t) have a Bode plot as shown below. The dashed lines
represent straight-line approximations. Sketch the Bode plot of
 .
.

Homework Answers

Add Answer to:
3. Let h(t) have a Bode plot as shown below. The dashed lines
represent straight-line approximations....
Problem 7: Sketch (using straight-line approximations) the Bode Plot of the following system. G(S)5010 s +2...
 Problem 7: Sketch (using straight-line approximations) the Bode Plot of the following system. G(S)5010 s +2 s + Problem 8: Sketch (using straight-line approximations) the Bode Plot of the following system. G(S) 100(s+ 1)2
Problem 3. Sketch the Bode plot (magnitude only) for the following transfer function. Label all slopes...
 Problem 3. Sketch the Bode plot (magnitude only) for the following transfer function. Label all slopes (dB/dec): (s 1000)(s 10,000) (s/100+1) (s/1000+1)(s/10,000+1) 7(s) T(s)- 0 dB 20 dB 0 40 dB 3 60 dB -80 dB -100 dB 10 10 103 104 105 106
The Bode magnitude plot of H(o) is shown Find H(w) 0.1 10 ? (rad/s) +20 dB/decade...
 The Bode magnitude plot of H(o) is shown Find H(w) 0.1 10 ? (rad/s) +20 dB/decade -40 dB/decade
Sketch the straight-line approximation Bode plot diagrams (magnitude and phase) 110s for H[s] You might want...
 Sketch the straight-line approximation Bode plot diagrams (magnitude and phase) 110s for H[s] You might want to examine Examples E.1 and E.2 in (s+10)(s+100)´ the textbook. Based on your straight-line Bode plot sketch, answer the following questions. The questions are: a. Identify the transfer function written in time constant form. b. The phase of H[s] at low frequencies is? c. The magnitude plot has what slope at low frequencies? d. The magnitude plot has what slope at high frequencies? e....
Figure 2 below shows a bode-plot of a Butterworth response filter, with cut-off frequency, fc of...
 Figure 2 below shows a bode-plot of a Butterworth response filter, with cut-off frequency, fc of 95 kHz and damping factor, a of 1. Define roll-off rate and explain how it effects the frequency response of this filter. Then, modify the frequency response to have a -80 dB/decade roll-off rate by redesigning the filter with appropriate structure and components value. Draw your filter design. Gain (normalized to 1) OdB -3 dB Actual response of a single-pole RC filter – Passband...
12.18 Find the transfer function G(0) using the Bode magnitude plot shown below. Hw G/dB) -20...
 12.18 Find the transfer function G(0) using the Bode magnitude plot shown below. Hw G/dB) -20 dB/decade 40 20 100 20 (rad/s) Figure P12.18 12.26 For the following circuit determine the resonant frequency and quality factor. c = 10 nF 2mA R,2k L0.1 mH c
HW11F19.pdf Download Q1 (10pts.): Extract an estimation of the transfer function that was used to create the Bode plot shown below IK- v(3) 20° 8dB 0d -8d 16d 24d -32dB -40d 48d -56dB -64d 72dB -80dB...
 HW11F19.pdf Download Q1 (10pts.): Extract an estimation of the transfer function that was used to create the Bode plot shown below IK- v(3) 20° 8dB 0d -8d 16d 24d -32dB -40d 48d -56dB -64d 72dB -80dB -20° -40° -60° -80° 100° 120 140° 160° ト·H 111翔 1-2 200° 100Hz 1MHz 10KHz 100KHz 1KHz 1. What kind of filter is it? 2. What order is the filter? 3. What is the DC, AC, or Midband Gain (not in dB)? 4. What...
3. The boat travels along a straight line with a speed shown in Fig. 3. Please...
 3. The boat travels along a straight line with a speed shown in Fig. 3. Please draw s-t and a-s if s =0,t=0. V (m/s) 60 20 100 200 (s) F1g. 3 V-s plot for Problem 3
3. (35 pts) Consider a standard RLC circuit with a resistor R, inductor L and capacitor C all in ...
 3. (35 pts) Consider a standard RLC circuit with a resistor R, inductor L and capacitor C all in series driven by a voltage source v(t). The voltage source gives pulses of 5 volts that last 1 msec every 10 msec, i.e. a square wave with period 10. We are interested in the output y(t) which is the current flowing through the circuit at time t. (a) Find a general expression for the frequency response H(jw) of this system (b)...
Let S be the solid obtained by rotating the region shown in the figure about the...
 Let S be the solid obtained by rotating the region shown in the figure about the y-axis. (Assume a = 7 and b = 2.) y-ax(x-by Sketch a typical approximating shell. y 101 ds 1.0 15 20 25 -2 1201 120 100% 100 80 50 60 X 40 -50 20H 0-1000 -6 What are its circumference cand height h? h(x) - Use shells to find the volume V of S. V Need Help? Red Watch it Talk to a Tutor
 Problem 7: Sketch (using straight-line approximations) the Bode Plot of the following system. G(S)5010 s +2 s + Problem 8: Sketch (using straight-line approximations) the Bode Plot of the following system. G(S) 100(s+ 1)2
 Problem 3. Sketch the Bode plot (magnitude only) for the following transfer function. Label all slopes (dB/dec): (s 1000)(s 10,000) (s/100+1) (s/1000+1)(s/10,000+1) 7(s) T(s)- 0 dB 20 dB 0 40 dB 3 60 dB -80 dB -100 dB 10 10 103 104 105 106
 The Bode magnitude plot of H(o) is shown Find H(w) 0.1 10 ? (rad/s) +20 dB/decade -40 dB/decade
 Sketch the straight-line approximation Bode plot diagrams (magnitude and phase) 110s for H[s] You might want to examine Examples E.1 and E.2 in (s+10)(s+100)´ the textbook. Based on your straight-line Bode plot sketch, answer the following questions. The questions are: a. Identify the transfer function written in time constant form. b. The phase of H[s] at low frequencies is? c. The magnitude plot has what slope at low frequencies? d. The magnitude plot has what slope at high frequencies? e....
 Figure 2 below shows a bode-plot of a Butterworth response filter, with cut-off frequency, fc of 95 kHz and damping factor, a of 1. Define roll-off rate and explain how it effects the frequency response of this filter. Then, modify the frequency response to have a -80 dB/decade roll-off rate by redesigning the filter with appropriate structure and components value. Draw your filter design. Gain (normalized to 1) OdB -3 dB Actual response of a single-pole RC filter – Passband...
 12.18 Find the transfer function G(0) using the Bode magnitude plot shown below. Hw G/dB) -20 dB/decade 40 20 100 20 (rad/s) Figure P12.18 12.26 For the following circuit determine the resonant frequency and quality factor. c = 10 nF 2mA R,2k L0.1 mH c
 HW11F19.pdf Download Q1 (10pts.): Extract an estimation of the transfer function that was used to create the Bode plot shown below IK- v(3) 20° 8dB 0d -8d 16d 24d -32dB -40d 48d -56dB -64d 72dB -80dB -20° -40° -60° -80° 100° 120 140° 160° ト·H 111翔 1-2 200° 100Hz 1MHz 10KHz 100KHz 1KHz 1. What kind of filter is it? 2. What order is the filter? 3. What is the DC, AC, or Midband Gain (not in dB)? 4. What...
 3. The boat travels along a straight line with a speed shown in Fig. 3. Please draw s-t and a-s if s =0,t=0. V (m/s) 60 20 100 200 (s) F1g. 3 V-s plot for Problem 3
 3. (35 pts) Consider a standard RLC circuit with a resistor R, inductor L and capacitor C all in series driven by a voltage source v(t). The voltage source gives pulses of 5 volts that last 1 msec every 10 msec, i.e. a square wave with period 10. We are interested in the output y(t) which is the current flowing through the circuit at time t. (a) Find a general expression for the frequency response H(jw) of this system (b)...
 Let S be the solid obtained by rotating the region shown in the figure about the y-axis. (Assume a = 7 and b = 2.) y-ax(x-by Sketch a typical approximating shell. y 101 ds 1.0 15 20 25 -2 1201 120 100% 100 80 50 60 X 40 -50 20H 0-1000 -6 What are its circumference cand height h? h(x) - Use shells to find the volume V of S. V Need Help? Red Watch it Talk to a Tutor
Most questions answered within 3 hours.
-
A uniform magnetic field is perpendicular to the plane of a wire
loop. If the loop...
asked 6 minutes ago -
Preparation of Benzoic Acid using a Grignard Reagent URGENT
1. During your Grignard formation, a small...
asked 7 minutes ago -
At the peak of your career, your were earning $120,000 and
holding a top level position....
asked 9 minutes ago -
. A permanent magnet is dropped south-end-down through a horizontal
circular coil with a radius of...
asked 11 minutes ago -
Bernie's Beverages purchased some fixed assets classified as
5-year property for MACRS. The assets cost $28,000....
asked 25 minutes ago -
How many ATPs are produced from the catabolism of a 10-C
molecule of fatty acid under...
asked 30 minutes ago -
Before practicing a routine on the rings, a 64.8 kg gymnast
hangs motionless, with one hand...
asked 31 minutes ago -
If the K b of a weak base is 6.3 × 10 − 6 , what...
asked 38 minutes ago -
Which of the following is the minimum amount of moles of NaOH
that must be added...
asked 41 minutes ago -
Stories about organizational ________ provide important clues
about cultural values and norms.
a. myths
b. heroes...
asked 43 minutes ago -
Explain the criteria used in selecting a target market
BUS220 Retail Management, thank you!
asked 45 minutes ago -
Convert/Calculate the following:
Determine the identity of an elemental gas if 4.55 L weighing
35.4g, under...
asked 48 minutes ago