
Homework Answers

Add Answer to:
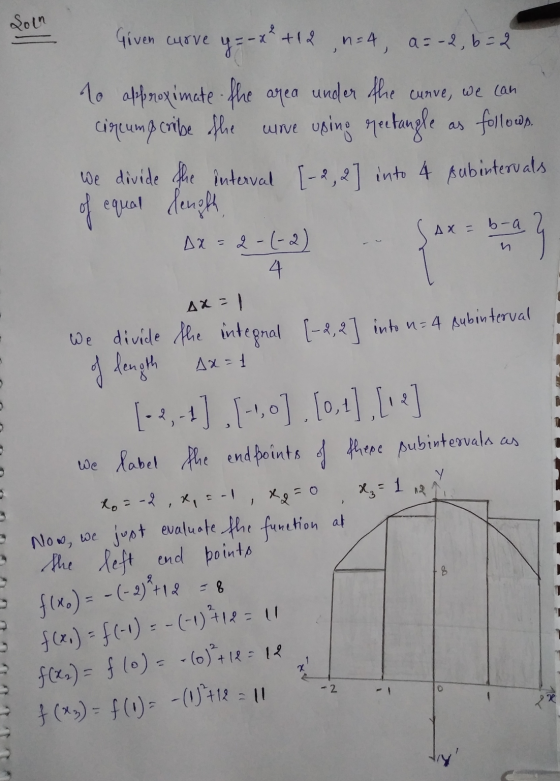
6. Approximate the area under the curve of y = -x2 + 12 over the interval...
under the Curve 2. Let y e2". a) Using 4 rectangles of equal width (Δ 1)and the rightendpoint of the subinterval for the height of the rectangle, estimate the area under the curve on the interval...
 under the Curve 2. Let y e2". a) Using 4 rectangles of equal width (Δ 1)and the rightendpoint of the subinterval for the height of the rectangle, estimate the area under the curve on the interval [0,4]. Then sketch a graph of the function over the interval along with the rectangles. b) Using 4 rectangles of equal width (Ax 1)and the left endpoint of the subinterval for the height of the rectangle, estimate the area under the curve on the...
Approximate the area under the graph of f(x) over the specified interval by dividing the interval...
 Approximate the area under the graph of f(x) over the specified interval by dividing the interval in number of subintervals and using the left endpoint of each subinterval. 20) f(x) = x2+2; interval [0,5); 5 subintervals A) 66 B) 40 C) 65 201 D) 32 Printed by Ana Dallallallalia mail done e
Approximate the area under a curve using left-endpoint approximation Question Given the graph of the function...
 Approximate the area under a curve using left-endpoint approximation Question Given the graph of the function f(a) below, use a left Riemann sum with 4 rectangles to approximate the integral So f(x) dr. 00 7 6 5 4 3 N 1 2 3 Select the correct answer below: BI Ne
Please show step by step. Approximate the area under the curve f(x) = -x2 + 6x...
 Please show step by step.
Approximate the area under the curve f(x) = -x2 + 6x + 7 from x = -1 to x = 3 by finding the Reimann Sum with n = 4 rectangles and using left hand endpoints.
Please show step by step.
Approximate the area under the curve f(x) = -x2 + 6x + 7 from x = -1 to x = 3 by finding the Reimann Sum with n = 4 rectangles and using left hand endpoints.
full steps and how to solve please 1. Let y-x'. a) Using 4 rectangles of equal width (Ar-2 )and the right endpoi...
 full steps and how to solve please
1. Let y-x'. a) Using 4 rectangles of equal width (Ar-2 )and the right endpoint of the subinterval for the height of the rectangle, estimate the area under the curve on the interval [0,8. Then sketch a graph of the function over the interval along with the rectangles. b) Using 4 rectangles of equal width (Ax 2 and the left endpoint of the subinterval for the height of the rectangle, estimate the area...
full steps and how to solve please
1. Let y-x'. a) Using 4 rectangles of equal width (Ar-2 )and the right endpoint of the subinterval for the height of the rectangle, estimate the area under the curve on the interval [0,8. Then sketch a graph of the function over the interval along with the rectangles. b) Using 4 rectangles of equal width (Ax 2 and the left endpoint of the subinterval for the height of the rectangle, estimate the area...
Approximate the area under the graph of f()=0.037 -2892 +98 over the interval [5.9] by dividing...
 Approximate the area under the graph of f()=0.037 -2892 +98 over the interval [5.9] by dividing the interval into 4 subintervals. Use the left endpoint of each subinterval The area under the graph of fix) = 0.037 -28972 +98 over the interval [5.9 is approximately I (Simplify your answer. Type an integer or a decimal Approximate the area under the graph of f(x)=0.03** -2.89x2.98 over the interval 15.9| by dividing the interval into 4 subintervals. Use the left endpoint of...
5. Consider the area under the curve f(x)-on the interval [1.4), (a) Sketch the curve and identify the area of interest. (b) Approximate the area using a right-hand Riemann sum with three re...
 5. Consider the area under the curve f(x)-on the interval [1.4), (a) Sketch the curve and identify the area of interest. (b) Approximate the area using a right-hand Riemann sum with three rectangles. (c) Find the exact area under the curve. We were unable to transcribe this image
5. Consider the area under the curve f(x)-on the interval [1.4), (a) Sketch the curve and identify the area of interest. (b) Approximate the area using a right-hand Riemann sum with three...
5. Consider the area under the curve f(x)-on the interval [1.4), (a) Sketch the curve and identify the area of interest. (b) Approximate the area using a right-hand Riemann sum with three rectangles. (c) Find the exact area under the curve. We were unable to transcribe this image
5. Consider the area under the curve f(x)-on the interval [1.4), (a) Sketch the curve and identify the area of interest. (b) Approximate the area using a right-hand Riemann sum with three...
over the interval (10 pts) 2) Approximate the area under the curve given by f(x) =...
 over the interval (10 pts) 2) Approximate the area under the curve given by f(x) = 5x2 - x (-3,5) using a Riemann sum with 6 equal subintervals.
Help please !!! answer all questions. thank u so much~! 1 Estimate the area under the...
 Help please !!! answer all questions. thank u so much~!
1 Estimate the area under the graph of f(x) rectangles and right endpoints. over the interval [0, 4] using five approximating x +4 Rn = Repeat the approximation using left endpoints. Ln= Report answers accurate to 4 places. Remember not to round too early in your calculations. Using Left Endpoint approximation, complete the following problems. Approximate the area under the curve f(x) = – 0.4x2 + 22 between x =...
Help please !!! answer all questions. thank u so much~!
1 Estimate the area under the graph of f(x) rectangles and right endpoints. over the interval [0, 4] using five approximating x +4 Rn = Repeat the approximation using left endpoints. Ln= Report answers accurate to 4 places. Remember not to round too early in your calculations. Using Left Endpoint approximation, complete the following problems. Approximate the area under the curve f(x) = – 0.4x2 + 22 between x =...
Approximate the area under the following curve and above the x-axis on the given interval, using rectangles whose height is the value of the function at the left side of the rectangle (a) Use two rec...
 Approximate the area under the following curve and above the x-axis on the given interval, using rectangles whose height is the value of the function at the left side of the rectangle (a) Use two rectangles. (b) Use four rectangles. (c) Use a graphing calculator (or other technology) and 40 rectangles. f(x)-2-x-1,1 (a) The approximated area when using two rectangles is square units (Type an integer or decimal rounded to two decimal places as needed.) (b) The approximated area when...
 under the Curve 2. Let y e2". a) Using 4 rectangles of equal width (Δ 1)and the rightendpoint of the subinterval for the height of the rectangle, estimate the area under the curve on the interval [0,4]. Then sketch a graph of the function over the interval along with the rectangles. b) Using 4 rectangles of equal width (Ax 1)and the left endpoint of the subinterval for the height of the rectangle, estimate the area under the curve on the...
 Approximate the area under the graph of f(x) over the specified interval by dividing the interval in number of subintervals and using the left endpoint of each subinterval. 20) f(x) = x2+2; interval [0,5); 5 subintervals A) 66 B) 40 C) 65 201 D) 32 Printed by Ana Dallallallalia mail done e
 Approximate the area under a curve using left-endpoint approximation Question Given the graph of the function f(a) below, use a left Riemann sum with 4 rectangles to approximate the integral So f(x) dr. 00 7 6 5 4 3 N 1 2 3 Select the correct answer below: BI Ne
 Please show step by step.
Approximate the area under the curve f(x) = -x2 + 6x + 7 from x = -1 to x = 3 by finding the Reimann Sum with n = 4 rectangles and using left hand endpoints.
Please show step by step.
Approximate the area under the curve f(x) = -x2 + 6x + 7 from x = -1 to x = 3 by finding the Reimann Sum with n = 4 rectangles and using left hand endpoints.
 full steps and how to solve please
1. Let y-x'. a) Using 4 rectangles of equal width (Ar-2 )and the right endpoint of the subinterval for the height of the rectangle, estimate the area under the curve on the interval [0,8. Then sketch a graph of the function over the interval along with the rectangles. b) Using 4 rectangles of equal width (Ax 2 and the left endpoint of the subinterval for the height of the rectangle, estimate the area...
full steps and how to solve please
1. Let y-x'. a) Using 4 rectangles of equal width (Ar-2 )and the right endpoint of the subinterval for the height of the rectangle, estimate the area under the curve on the interval [0,8. Then sketch a graph of the function over the interval along with the rectangles. b) Using 4 rectangles of equal width (Ax 2 and the left endpoint of the subinterval for the height of the rectangle, estimate the area...
 Approximate the area under the graph of f()=0.037 -2892 +98 over the interval [5.9] by dividing the interval into 4 subintervals. Use the left endpoint of each subinterval The area under the graph of fix) = 0.037 -28972 +98 over the interval [5.9 is approximately I (Simplify your answer. Type an integer or a decimal Approximate the area under the graph of f(x)=0.03** -2.89x2.98 over the interval 15.9| by dividing the interval into 4 subintervals. Use the left endpoint of...
 5. Consider the area under the curve f(x)-on the interval [1.4), (a) Sketch the curve and identify the area of interest. (b) Approximate the area using a right-hand Riemann sum with three rectangles. (c) Find the exact area under the curve. We were unable to transcribe this image
5. Consider the area under the curve f(x)-on the interval [1.4), (a) Sketch the curve and identify the area of interest. (b) Approximate the area using a right-hand Riemann sum with three...
5. Consider the area under the curve f(x)-on the interval [1.4), (a) Sketch the curve and identify the area of interest. (b) Approximate the area using a right-hand Riemann sum with three rectangles. (c) Find the exact area under the curve. We were unable to transcribe this image
5. Consider the area under the curve f(x)-on the interval [1.4), (a) Sketch the curve and identify the area of interest. (b) Approximate the area using a right-hand Riemann sum with three...
 over the interval (10 pts) 2) Approximate the area under the curve given by f(x) = 5x2 - x (-3,5) using a Riemann sum with 6 equal subintervals.
 Help please !!! answer all questions. thank u so much~!
1 Estimate the area under the graph of f(x) rectangles and right endpoints. over the interval [0, 4] using five approximating x +4 Rn = Repeat the approximation using left endpoints. Ln= Report answers accurate to 4 places. Remember not to round too early in your calculations. Using Left Endpoint approximation, complete the following problems. Approximate the area under the curve f(x) = – 0.4x2 + 22 between x =...
Help please !!! answer all questions. thank u so much~!
1 Estimate the area under the graph of f(x) rectangles and right endpoints. over the interval [0, 4] using five approximating x +4 Rn = Repeat the approximation using left endpoints. Ln= Report answers accurate to 4 places. Remember not to round too early in your calculations. Using Left Endpoint approximation, complete the following problems. Approximate the area under the curve f(x) = – 0.4x2 + 22 between x =...
 Approximate the area under the following curve and above the x-axis on the given interval, using rectangles whose height is the value of the function at the left side of the rectangle (a) Use two rectangles. (b) Use four rectangles. (c) Use a graphing calculator (or other technology) and 40 rectangles. f(x)-2-x-1,1 (a) The approximated area when using two rectangles is square units (Type an integer or decimal rounded to two decimal places as needed.) (b) The approximated area when...
Most questions answered within 3 hours.
-
1. What five (5) basic parameters need to be measured
during a pump test in order...
asked 5 minutes ago -
One student ran a TLC of an unknown compound on a
silica gel plate and the...
asked 8 minutes ago -
Use inheritance to create a new class AudioRecording
based on Recording class that:
it will retain...
asked 13 minutes ago -
In the long run, an increase in the quantity of money ________
the value of money...
asked 19 minutes ago -
In February 2008, a team of Canadian scientists revealed rare
new horseshoe crab fossils from 445...
asked 24 minutes ago -
a firm produces output according to the following function q=
f(L,K) = L^1/2K^3/2. The cost of...
asked 22 minutes ago -
Please
NO HANDWRITING
NO COPY & PASTE from the internet
On March 6, 2019, Mark Zuckerberg...
asked 23 minutes ago -
Please make a JAVA program for the following using switch
structures
Write a program that simulates...
asked 26 minutes ago -
in
2011, real gdp in the united states was below potential gdp. This
fact definitely means...
asked 28 minutes ago -
Describe how the file manager allocates a file to a single user.
List the steps that...
asked 52 minutes ago -
For the following reaction:
IBr(g) + 4F2(g) → IF5(g) +
BrF3(g)
Compound
ΔH°f (kJ mol-1)...
asked 53 minutes ago -
Assuming the simple probability of even A is given as P(A) and
the simple probability of...
asked 56 minutes ago