
Homework Answers


For any queries please comment
If you are satisfied with the solution, please click the LIKE THUMB.
Add Answer to:
Compute RNOA, Net Operating Profit Margin, and NOA Turnover for Competitors Selected balance sheet and income...
Compute RNOA, Net Operating Profit Margin, and NOA Turnover Selected balance sheet and income statement information...
 Compute RNOA, Net Operating Profit Margin, and NOA Turnover Selected balance sheet and income statement information for Netflix Inc. the world's leading Internet entertainment service, follows. 2018 Net 2017 Net 2018 2018 Operating Operating Revenue NOPAT Assets Assets $15,794,341 $1,506,681 $11,804,340 $7,258,593 Company ($ thousands) Ticker Netflix, Inc NFLX a. Compute return on net operating assets (RNOA). Note: Round percentage to one decimal places (for example, enter 6.7% for 6.6555%). % b. Disaggregate RNOA into net operating profit margin (NOPM)...
E4-31. Compute and Interpret RNOA, Profit Margin, and Asset Turnover of Competitors Selected balance sheet and...
 E4-31. Compute and Interpret RNOA, Profit Margin, and Asset Turnover of Competitors Selected balance sheet and income statement information for drug store retailers CVS Health Corp. and Walgreens Boots Alliance follows. 2015 Net Operating Assets 2015 Sales Company ($ millions) 2014 Net Operating Assets 2015 NOPAT Ticker CVS Health ........... CVS Walgreens Boots Alliance WBA $153,290 103,444 $5,758 3,642 $62,159 42,683 $48,338 22,461 a. Compute the 2015 return on net operating assets (RNOA) for each company. b. Disaggregate RNOA into...
E4-33. Compute, Disaggregate, and Interpret RNOA of Competitors Selected balance sheet and income statement information for...
 E4-33. Compute, Disaggregate, and Interpret RNOA of Competitors Selected balance sheet and income statement information for the clothing retailers Nordstrom Inc. and L Brands Inc. follows. 2015 Sales 2015 Net Operating Assets 2015 NOPAT 2014 Net Operating Assets Company ($ millions) Ticker Nordstrom............ L Brands ........... JWN LTD $14,095 12,154 $ 679 1,416 $3,081 2,915 $4,744 3,060 a. Compute the 2015 return on net operating assets (RNOA) for each company. b. Disaggregate RNOA into net operating profit margin (NOPM) and...
Compute, Disaggregate, and Interpret ROE and RNOA Graphical representations of the Ingersoll Rand 2018 income statement...
 Compute, Disaggregate, and Interpret ROE and RNOA Graphical representations of the Ingersoll Rand 2018 income statement and average balance sheets (2017-2018) follow. Income Statement 2018 Average Balance Sheet 2017-2018 $54.4 $7,081.5 $4,077.7 $16,817.7 $15,668.2 $14,088.7 $6,830.6 $1,337.6 $1,226.4 Operating assets Nonoperating assets Operating expenses including tax on operating profit Operating liabilities Nonoperating liabilities Earning attributable to company shareholders Company shareholders' Noncontrolling interest Sales equity a. Compute the 2018 return on equity (ROE) and 2018 return on net operating assets (RNOA)....
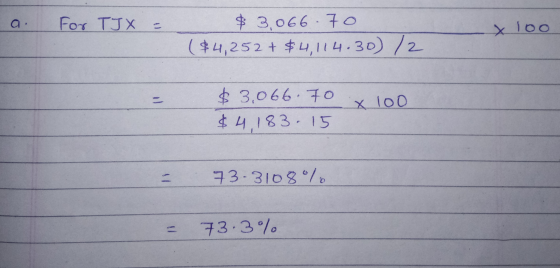
Comparing Abercrombie & Fitch and TJX Companies Following are selected financial statement data from Abercrombie & Fitch (ANF-upscale clothing retailer) and TJX Companies (TJX-value-priced clo...
Comparing Abercrombie & Fitch and TJX Companies Following are selected financial statement data from Abercrombie & Fitch (ANF-upscale clothing retailer) and TJX Companies (TJX-value-priced clothing retailer including TJ Maxx). ($ thousands) Company Total Assets Net Income Sales 2015 TJX Companies Inc. $10,988,750 2016 TJX Companies Inc. 11,499,482 $2,277,658 $30,944,938 2015 Abercrombie & Fitch 2,505,167 2016 Abercrombie & Fitch 2,443,039 35,576 3,518,680 (a) Compute the return on assets for both companies for the year ended 2016. Round your answers to one...
Graphical representations of the Ingersoll Rand 2018 income statement and average balance sheets (2017-2018) follow. Compute,...
 Graphical representations of the Ingersoll Rand 2018 income
statement and average balance sheets (2017-2018) follow.
Compute, Disaggregate, and Interpret ROE and RNOA Graphical representations of the Ingersoll Rand 2018 income statement and average balance sheets (2017-2018) follow. Income Statement 2018 Average Balance Sheet 2017-2018 $54.4 $7,081,5 S15,6682 $14,088.7 $4,077.7 $16,817.7 S6,830,6 $1,337,6 $1.226.4 Operating assets Nonoperating assets Operating expenses including tax on operating profit Operating liabilities Nonoperating abilities Earning attributable to company shareholders Company shareholders' Noncontrolling interest Sales equity a....
Graphical representations of the Ingersoll Rand 2018 income
statement and average balance sheets (2017-2018) follow.
Compute, Disaggregate, and Interpret ROE and RNOA Graphical representations of the Ingersoll Rand 2018 income statement and average balance sheets (2017-2018) follow. Income Statement 2018 Average Balance Sheet 2017-2018 $54.4 $7,081,5 S15,6682 $14,088.7 $4,077.7 $16,817.7 S6,830,6 $1,337,6 $1.226.4 Operating assets Nonoperating assets Operating expenses including tax on operating profit Operating liabilities Nonoperating abilities Earning attributable to company shareholders Company shareholders' Noncontrolling interest Sales equity a....
Which statement is TRUE? A. The two components of RNOA, net operating profit margin and NOA...
Which statement is TRUE? A. The two components of RNOA, net operating profit margin and NOA turnover, are independent of each other. B. A decrease in net operating profit margin will cause both return on net operating assets and return on equity to decrease, all other things being equal. C. If a company has rapidly growing earnings per share, their return on net operating assets must be increasing too. D. Return on net operating assets will always be greater than...
Graphical representations of the Ingersoll Rand 2018 income statement and average balance sheets (2017-2018) follow. Compute,...
 Graphical representations of the Ingersoll Rand 2018 income
statement and average balance sheets (2017-2018) follow.
Compute, Disaggregate, and Interpret ROE and RNOA Graphical representations of the Ingersoll Rand 2018 income statement and average balance sheets (2017-2018) follow. Income Statement 2018 Average Balance Sheet 2017-2018 $54.4 $7,081,5 $15,668 2 $14,088.7 $4,077.7 $16,817.7 $6,830,6 $1,226.4 $1,337,6 Operating assets Nonoperating assets Operating expenses including tax on operating profit Operating liabilities Nonoperating liabilities Earning attributable to company shareholders Company shareholders Noncontrolling interest Sales equity...
Graphical representations of the Ingersoll Rand 2018 income
statement and average balance sheets (2017-2018) follow.
Compute, Disaggregate, and Interpret ROE and RNOA Graphical representations of the Ingersoll Rand 2018 income statement and average balance sheets (2017-2018) follow. Income Statement 2018 Average Balance Sheet 2017-2018 $54.4 $7,081,5 $15,668 2 $14,088.7 $4,077.7 $16,817.7 $6,830,6 $1,226.4 $1,337,6 Operating assets Nonoperating assets Operating expenses including tax on operating profit Operating liabilities Nonoperating liabilities Earning attributable to company shareholders Company shareholders Noncontrolling interest Sales equity...
Compute, Disaggregate, and Interpret RNOA of Competitors Halliburton and Schlumberger compete in the oil field services...
 Compute, Disaggregate, and Interpret RNOA of Competitors Halliburton and Schlumberger compete in the oil field services sector. Refer to the following 2018 financial data for the two companies to answer the requirements. $ millions HAL SLB Total revenue $23,995 $32,815 Pretax net nonoperating expense 653 426 Net income 1,657 2,177 Average operating assets 23,361 67,836 Average operating liabilities 5,888 16,499 Marginal tax rate 22% 19% Return on equity 18.56% 5.86% a. Compute return on net operating assets (RNOA) for each...
 Compute RNOA, Net Operating Profit Margin, and NOA Turnover Selected balance sheet and income statement information for Netflix Inc. the world's leading Internet entertainment service, follows. 2018 Net 2017 Net 2018 2018 Operating Operating Revenue NOPAT Assets Assets $15,794,341 $1,506,681 $11,804,340 $7,258,593 Company ($ thousands) Ticker Netflix, Inc NFLX a. Compute return on net operating assets (RNOA). Note: Round percentage to one decimal places (for example, enter 6.7% for 6.6555%). % b. Disaggregate RNOA into net operating profit margin (NOPM)...
 E4-31. Compute and Interpret RNOA, Profit Margin, and Asset Turnover of Competitors Selected balance sheet and income statement information for drug store retailers CVS Health Corp. and Walgreens Boots Alliance follows. 2015 Net Operating Assets 2015 Sales Company ($ millions) 2014 Net Operating Assets 2015 NOPAT Ticker CVS Health ........... CVS Walgreens Boots Alliance WBA $153,290 103,444 $5,758 3,642 $62,159 42,683 $48,338 22,461 a. Compute the 2015 return on net operating assets (RNOA) for each company. b. Disaggregate RNOA into...
 E4-33. Compute, Disaggregate, and Interpret RNOA of Competitors Selected balance sheet and income statement information for the clothing retailers Nordstrom Inc. and L Brands Inc. follows. 2015 Sales 2015 Net Operating Assets 2015 NOPAT 2014 Net Operating Assets Company ($ millions) Ticker Nordstrom............ L Brands ........... JWN LTD $14,095 12,154 $ 679 1,416 $3,081 2,915 $4,744 3,060 a. Compute the 2015 return on net operating assets (RNOA) for each company. b. Disaggregate RNOA into net operating profit margin (NOPM) and...
 Compute, Disaggregate, and Interpret ROE and RNOA Graphical representations of the Ingersoll Rand 2018 income statement and average balance sheets (2017-2018) follow. Income Statement 2018 Average Balance Sheet 2017-2018 $54.4 $7,081.5 $4,077.7 $16,817.7 $15,668.2 $14,088.7 $6,830.6 $1,337.6 $1,226.4 Operating assets Nonoperating assets Operating expenses including tax on operating profit Operating liabilities Nonoperating liabilities Earning attributable to company shareholders Company shareholders' Noncontrolling interest Sales equity a. Compute the 2018 return on equity (ROE) and 2018 return on net operating assets (RNOA)....
 Graphical representations of the Ingersoll Rand 2018 income
statement and average balance sheets (2017-2018) follow.
Compute, Disaggregate, and Interpret ROE and RNOA Graphical representations of the Ingersoll Rand 2018 income statement and average balance sheets (2017-2018) follow. Income Statement 2018 Average Balance Sheet 2017-2018 $54.4 $7,081,5 S15,6682 $14,088.7 $4,077.7 $16,817.7 S6,830,6 $1,337,6 $1.226.4 Operating assets Nonoperating assets Operating expenses including tax on operating profit Operating liabilities Nonoperating abilities Earning attributable to company shareholders Company shareholders' Noncontrolling interest Sales equity a....
Graphical representations of the Ingersoll Rand 2018 income
statement and average balance sheets (2017-2018) follow.
Compute, Disaggregate, and Interpret ROE and RNOA Graphical representations of the Ingersoll Rand 2018 income statement and average balance sheets (2017-2018) follow. Income Statement 2018 Average Balance Sheet 2017-2018 $54.4 $7,081,5 S15,6682 $14,088.7 $4,077.7 $16,817.7 S6,830,6 $1,337,6 $1.226.4 Operating assets Nonoperating assets Operating expenses including tax on operating profit Operating liabilities Nonoperating abilities Earning attributable to company shareholders Company shareholders' Noncontrolling interest Sales equity a....
 Graphical representations of the Ingersoll Rand 2018 income
statement and average balance sheets (2017-2018) follow.
Compute, Disaggregate, and Interpret ROE and RNOA Graphical representations of the Ingersoll Rand 2018 income statement and average balance sheets (2017-2018) follow. Income Statement 2018 Average Balance Sheet 2017-2018 $54.4 $7,081,5 $15,668 2 $14,088.7 $4,077.7 $16,817.7 $6,830,6 $1,226.4 $1,337,6 Operating assets Nonoperating assets Operating expenses including tax on operating profit Operating liabilities Nonoperating liabilities Earning attributable to company shareholders Company shareholders Noncontrolling interest Sales equity...
Graphical representations of the Ingersoll Rand 2018 income
statement and average balance sheets (2017-2018) follow.
Compute, Disaggregate, and Interpret ROE and RNOA Graphical representations of the Ingersoll Rand 2018 income statement and average balance sheets (2017-2018) follow. Income Statement 2018 Average Balance Sheet 2017-2018 $54.4 $7,081,5 $15,668 2 $14,088.7 $4,077.7 $16,817.7 $6,830,6 $1,226.4 $1,337,6 Operating assets Nonoperating assets Operating expenses including tax on operating profit Operating liabilities Nonoperating liabilities Earning attributable to company shareholders Company shareholders Noncontrolling interest Sales equity...
 Compute, Disaggregate, and Interpret RNOA of Competitors Halliburton and Schlumberger compete in the oil field services sector. Refer to the following 2018 financial data for the two companies to answer the requirements. $ millions HAL SLB Total revenue $23,995 $32,815 Pretax net nonoperating expense 653 426 Net income 1,657 2,177 Average operating assets 23,361 67,836 Average operating liabilities 5,888 16,499 Marginal tax rate 22% 19% Return on equity 18.56% 5.86% a. Compute return on net operating assets (RNOA) for each...
 Compute, Disaggregate, and Interpret RNOA of Competitors Halliburton and Schlumberger compete in the oil field services sector. Refer to the following 2018 financial data for the two companies to answer the requirements. $ millions HAL SLB Total revenue $23,995 $32,815 Pretax net nonoperating expense 653 426 Net income 1,657 2,177 Average operating assets 23,361 67,836 Average operating liabilities 5,888 16,499 Marginal tax rate 22% 19% Return on equity 18.56% 5.86% a. Compute return on net operating assets (RNOA) for each...
Most questions answered within 3 hours.
-
Question Three
Suppose you as project manager are using the Waterfall
development methodology on a large...
asked 37 minutes ago -
Which statement is not true about welfare in Canada?
A.Benefits typically vary based on one's ability...
asked 1 hour ago -
Please help me with FLOWCHART and UML diagram for class,
thank you!
#include <iostream>
#include <fstream>...
asked 1 hour ago -
3. Describe the “logic circuit” of the Lac operon. Which
proteins are bound or not to...
asked 1 hour ago -
Ayesha’s adjusted gross income is $60,000 in 2019. She donated a
piece of artwork with a...
asked 2 hours ago -
For Dijkstra’s shortest path algorithm:
a. Give the Big-O time for Dijkstra’s shortest path algorithm
and...
asked 2 hours ago -
Phosphorus violates the 'octet rule' in biological molecules,
forming more covalent bonds than expected based on...
asked 2 hours ago -
A 1.3 eV electron has a 10-4 probability of tunneling
through a 2.4 eV potential barrier....
asked 2 hours ago -
What is the one ingredient that is common to being successful
with all stakeholders?
profit
trust...
asked 2 hours ago -
Write an assembly language 32 bit program that reads in lines of
text by a .txt...
asked 2 hours ago -
what is the density ( in g/L) of hydrogen gas at 29 degrees C and a...
asked 2 hours ago -
5-6. You are considering three investment alternatives for some
spare cash: Old Reliable Corporation stock (A1),...
asked 2 hours ago