Comparing Abercrombie & Fitch and TJX Companies Following are selected financial statement data from Abercrombie & Fitch (ANF-upscale clothing retailer) and TJX Companies (TJX-value-priced clo...
Comparing
Abercrombie & Fitch and TJX Companies
Following are selected financial statement data from Abercrombie
& Fitch (ANF-upscale clothing retailer) and TJX Companies
(TJX-value-priced clothing retailer including TJ Maxx).
| ($ thousands) | Company | Total Assets | Net Income | Sales |
|---|---|---|---|---|
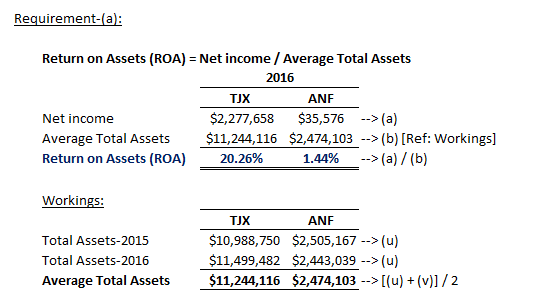
| 2015 | TJX Companies Inc. | $10,988,750 | ||
| 2016 | TJX Companies Inc. | 11,499,482 | $2,277,658 | $30,944,938 |
| 2015 | Abercrombie & Fitch | 2,505,167 | ||
| 2016 | Abercrombie & Fitch | 2,443,039 | 35,576 | 3,518,680 |
(a) Compute the return on assets for both companies for the year
ended 2016.
Round your answers to one decimal place.
TJX 2016
ROA = Answer%
ANF 2016 ROA = Answer%
(b) Disaggregate the ROAs for both companies into the profit margin
and asset turnover.
Round profit margin answers to one decimal place.
TJX 2016 Profit
Margin = Answer%
ANF 2016 Profit Margin = Answer%
Round asset turnover answers to two decimal places.
TJX 2016 Asset
Turnover = Answer
ANF 2016 Asset Turnover = Answer
(c) Which company has better financial performance?
ANF turns its assets much faster than TJX and this is the primary reason for its higher return on assets.
ANF is realizing a higher return on assets as a result of its lower investment in assets.
TJX is outperforming ANF on both dimensions, resulting in a ROA higher than ANF's.
ANF's higher return on assets is the result of its greater level of sales.
Homework Answers

Add Answer to:
Comparing Abercrombie & Fitch and TJX Companies Following are selected financial statement data from Abercrombie & Fitch (ANF-upscale clothing retailer) and TJX Companies (TJX-value-priced clo...
Comparing Abercrombie & Fitch and TX Companies Following are selected financial statement data from Abercrombie &...
 Comparing Abercrombie & Fitch and TX Companies Following are selected financial statement data from Abercrombie & Fach (ANF-upscale clothing retaler) and TDX Companies (T-value priced clothing retailer including T Maxx)-both dated the end of January 2009 or 2008. Tetal Assets Net Income Sales Auedu Abercrembe & FRch Abercrombie & Fech (a) Compute the return on assets for both companies for the year ended january 2009. Round your answers to one decimal place. VO 6002 xi %3* YON 6002 INY OL...
E2-33. Comparing Income Statements and Balance Sheets of Competitors Following are selected income statement and balance...
 E2-33. Comparing Income Statements and Balance Sheets of Competitors Following are selected income statement and balance sheet data from two retailers, Abercrombie & Fitch (clothing retailer in the high-end market) and TJX Companies (clothing retailer in the value- priced market), for the fiscal year ended January 30, 2016. ANF TJX Income Statement ($ thousands) Sales. Cost of goods sold .... Gross profit........... Total expenses........ Net income...... $3,518,680 1,361,137 2,157,543 2,121,967 $ 35,576 $30,944,938 22,034,523 8,910,415 6,632,757 $ 2,277,658 Balance Sheet...
Compute RNOA, Net Operating Profit Margin, and NOA Turnover for Competitors Selected balance sheet and income...
 Compute RNOA, Net Operating Profit Margin, and NOA Turnover for Competitors Selected balance sheet and income statement information for the fiscal year ended February 2, 2019, for Abercrombie & Fitch Co. and TJX Companies Inc., clothing retailers in the high-end and value-priced segments, respectively, follows. Current Prior Year Net Year Net Operating Operating Assets Assets Company ($ millions) Ticker Abercrombie & Fitch ANE TJX Companies TJX Sales NOPAT $3,590.10 $87.40 38,972.90 3,066.70 $792.30 $877.30 4,252.00 4,114.30 Compute the following ratios...
Formulating Financial Statements from Raw Data Following is selected financial information from Abercrombie& Fitch for its...
 Formulating Financial Statements from Raw Data Following is selected financial information from Abercrombie& Fitch for its fiscal year ended January 30, 2016 ( thousands) .. $1,844,461 Cash from operating activities Noncash assets Cash from investing activities. .. . Cash, ending year . . . $ 309,941 (119,504) 520,708 (122,567) Cash from financing activities*.... . . . . . . . . .. . .1,137,317 Total expenses (other than cost Cash from financing activities includes the effects of foreign exchange rate...
Comparing Income Statements and Balance Sheets of Competitors Following are selected income statement and balance sheet...
 Comparing Income Statements and Balance Sheets of Competitors Following are selected income statement and balance sheet data from two retailers: Abercrombie & Fitch (clothing retailer in the high-end market) and TJX Companies (clothing retailer in the value-priced market) (a) Express each income statement amount as a percentage of sales. Round your answers to one decimal place (ex: 0.2345-23.5%) Income Statement ANF $3,750 1,239 TJX $18,647 14,082 ($ millions) Sales Cost of goods sold 0% 0% Gross profit 2,511 4,565 0%...
The following data are based on information in the 2016 annual reports of Abercrombie & Fitch,...
 The following data are based on information in the 2016 annual reports of Abercrombie & Fitch, Co., and American Eagle Outfitters, Inc. Dollar amounts are in thousands. Abercrombie & Fitch is a specialty retailer of apparel and accessories for men and children. As of January 30, 2016, it operated 754 stores in the United States and 178 stores outside the United States. American Eagle Outfitters, Inc. is a specialty retailer of clothing and accessories for men and women. As of...
5.22. Compute ROA, Profit Margin and Asset Turnover for Competitors Selected balance sheet and income statement...
 5.22. Compute ROA, Profit Margin and Asset Turnover for Competitors Selected balance sheet and income statement information from Urban Outfitters, Inc. and TJX Companies, clothing retailers in the high-end and value-priced segments, respectively, follows. 2014 Earnings 2014 Without Interest 2014 Total 2013 Total Company ($ millions) Sales Expense (EWI) Assets Assets Urban Outfitters ....... ....... $ 3,323 $ 232.4 $ 1,889 $ 2,221 TJX Companies ... ........ 29,078 2,241.0 11,128 10,201 a. Compute the 2014 return on assets (ROA) for...
Compute ROA, Profit Margin and Asset Turnover for Competitors Selected balance sheet and income statement information...
 Compute ROA, Profit Margin and Asset Turnover for Competitors Selected balance sheet and income statement information from Urban Outfitters, Inc. and TJX Companies, clothing retailers in the high-end and value.priced segments, respectively, follows (in millions). 2014 2014 2014 2013 Company Sales EW* Total Assets Total Assets Urban Outfitters 53.323 $232.4 $1,889 $2.221 TJX Companies 29,078 2.241 11.128 10,201 *EWI = Earnings without interest expense a. Compute the 2014 return on assets (ROA) for both companies. Round answers to one decimal...
Question 1 Not yet answered Marked out of 29.00 Comparing Income Statements and Balance Sheets of...
 Question 1 Not yet answered Marked out of 29.00 Comparing Income Statements and Balance Sheets of Competitors Following are selected income statement and balance sheet data from two retailers: Abercrombie & Fitch (clothing retailer in the high-end market) and TJX Companies (clothing retailer in the value-priced market). (a) Express each income statement amount as a percentage of sales. Round your answers to one decimal place (ex: 0.2345 = 23.5%). (5 millions) Sales Cost of goods sold Gross profit Total expenses...
Answer question please. Formulating Financial Statements from Raw Data Following is selected financial information from Abercrombie...
 Answer question please.
Formulating Financial Statements from Raw Data Following is selected financial information from Abercrombie & Fitch for its fiscal year ended February 1, 2014 ($ millions): Cash Asset $826 Cash flows from operations 396.2 Sales 3,469 19 Stockholders' Equity 1,891 Cost of Goods Sold 1.257 1,757 Cash flows from financing (143) (1438 1,050 Other Expenses, including income taxes 2,062 2.115 Noncash Assets No cash Assets Cash flows from investing 193) 173) Net Income 150 Effect of exchange rate...
Answer question please.
Formulating Financial Statements from Raw Data Following is selected financial information from Abercrombie & Fitch for its fiscal year ended February 1, 2014 ($ millions): Cash Asset $826 Cash flows from operations 396.2 Sales 3,469 19 Stockholders' Equity 1,891 Cost of Goods Sold 1.257 1,757 Cash flows from financing (143) (1438 1,050 Other Expenses, including income taxes 2,062 2.115 Noncash Assets No cash Assets Cash flows from investing 193) 173) Net Income 150 Effect of exchange rate...
 Comparing Abercrombie & Fitch and TX Companies Following are selected financial statement data from Abercrombie & Fach (ANF-upscale clothing retaler) and TDX Companies (T-value priced clothing retailer including T Maxx)-both dated the end of January 2009 or 2008. Tetal Assets Net Income Sales Auedu Abercrembe & FRch Abercrombie & Fech (a) Compute the return on assets for both companies for the year ended january 2009. Round your answers to one decimal place. VO 6002 xi %3* YON 6002 INY OL...
 E2-33. Comparing Income Statements and Balance Sheets of Competitors Following are selected income statement and balance sheet data from two retailers, Abercrombie & Fitch (clothing retailer in the high-end market) and TJX Companies (clothing retailer in the value- priced market), for the fiscal year ended January 30, 2016. ANF TJX Income Statement ($ thousands) Sales. Cost of goods sold .... Gross profit........... Total expenses........ Net income...... $3,518,680 1,361,137 2,157,543 2,121,967 $ 35,576 $30,944,938 22,034,523 8,910,415 6,632,757 $ 2,277,658 Balance Sheet...
 Compute RNOA, Net Operating Profit Margin, and NOA Turnover for Competitors Selected balance sheet and income statement information for the fiscal year ended February 2, 2019, for Abercrombie & Fitch Co. and TJX Companies Inc., clothing retailers in the high-end and value-priced segments, respectively, follows. Current Prior Year Net Year Net Operating Operating Assets Assets Company ($ millions) Ticker Abercrombie & Fitch ANE TJX Companies TJX Sales NOPAT $3,590.10 $87.40 38,972.90 3,066.70 $792.30 $877.30 4,252.00 4,114.30 Compute the following ratios...
 Formulating Financial Statements from Raw Data Following is selected financial information from Abercrombie& Fitch for its fiscal year ended January 30, 2016 ( thousands) .. $1,844,461 Cash from operating activities Noncash assets Cash from investing activities. .. . Cash, ending year . . . $ 309,941 (119,504) 520,708 (122,567) Cash from financing activities*.... . . . . . . . . .. . .1,137,317 Total expenses (other than cost Cash from financing activities includes the effects of foreign exchange rate...
 Comparing Income Statements and Balance Sheets of Competitors Following are selected income statement and balance sheet data from two retailers: Abercrombie & Fitch (clothing retailer in the high-end market) and TJX Companies (clothing retailer in the value-priced market) (a) Express each income statement amount as a percentage of sales. Round your answers to one decimal place (ex: 0.2345-23.5%) Income Statement ANF $3,750 1,239 TJX $18,647 14,082 ($ millions) Sales Cost of goods sold 0% 0% Gross profit 2,511 4,565 0%...
 The following data are based on information in the 2016 annual reports of Abercrombie & Fitch, Co., and American Eagle Outfitters, Inc. Dollar amounts are in thousands. Abercrombie & Fitch is a specialty retailer of apparel and accessories for men and children. As of January 30, 2016, it operated 754 stores in the United States and 178 stores outside the United States. American Eagle Outfitters, Inc. is a specialty retailer of clothing and accessories for men and women. As of...
 5.22. Compute ROA, Profit Margin and Asset Turnover for Competitors Selected balance sheet and income statement information from Urban Outfitters, Inc. and TJX Companies, clothing retailers in the high-end and value-priced segments, respectively, follows. 2014 Earnings 2014 Without Interest 2014 Total 2013 Total Company ($ millions) Sales Expense (EWI) Assets Assets Urban Outfitters ....... ....... $ 3,323 $ 232.4 $ 1,889 $ 2,221 TJX Companies ... ........ 29,078 2,241.0 11,128 10,201 a. Compute the 2014 return on assets (ROA) for...
 Compute ROA, Profit Margin and Asset Turnover for Competitors Selected balance sheet and income statement information from Urban Outfitters, Inc. and TJX Companies, clothing retailers in the high-end and value.priced segments, respectively, follows (in millions). 2014 2014 2014 2013 Company Sales EW* Total Assets Total Assets Urban Outfitters 53.323 $232.4 $1,889 $2.221 TJX Companies 29,078 2.241 11.128 10,201 *EWI = Earnings without interest expense a. Compute the 2014 return on assets (ROA) for both companies. Round answers to one decimal...
 Question 1 Not yet answered Marked out of 29.00 Comparing Income Statements and Balance Sheets of Competitors Following are selected income statement and balance sheet data from two retailers: Abercrombie & Fitch (clothing retailer in the high-end market) and TJX Companies (clothing retailer in the value-priced market). (a) Express each income statement amount as a percentage of sales. Round your answers to one decimal place (ex: 0.2345 = 23.5%). (5 millions) Sales Cost of goods sold Gross profit Total expenses...
 Answer question please.
Formulating Financial Statements from Raw Data Following is selected financial information from Abercrombie & Fitch for its fiscal year ended February 1, 2014 ($ millions): Cash Asset $826 Cash flows from operations 396.2 Sales 3,469 19 Stockholders' Equity 1,891 Cost of Goods Sold 1.257 1,757 Cash flows from financing (143) (1438 1,050 Other Expenses, including income taxes 2,062 2.115 Noncash Assets No cash Assets Cash flows from investing 193) 173) Net Income 150 Effect of exchange rate...
Answer question please.
Formulating Financial Statements from Raw Data Following is selected financial information from Abercrombie & Fitch for its fiscal year ended February 1, 2014 ($ millions): Cash Asset $826 Cash flows from operations 396.2 Sales 3,469 19 Stockholders' Equity 1,891 Cost of Goods Sold 1.257 1,757 Cash flows from financing (143) (1438 1,050 Other Expenses, including income taxes 2,062 2.115 Noncash Assets No cash Assets Cash flows from investing 193) 173) Net Income 150 Effect of exchange rate...
Most questions answered within 3 hours.
-
A sample of 45 observations is selected from a normal
population. The sample mean is 49,...
asked 1 minute from now -
A firm operating in a purely competitive environment is faced
with a market price of $250....
asked 2 minutes ago -
•Let’s say someone claims the average population size is
600 feet squared and the housing authority...
asked 10 minutes ago -
Cynaide is a deadly poison that blocks the last step in the
electron transport chain of...
asked 14 minutes ago -
Your friend tells you that there is a vending machine on campus
that dispenses M&M packs...
asked 29 minutes ago -
What advantages are there to using piperidine rather than
hydroxide as a base?
asked 28 minutes ago -
7. The life of a Freeze Breeze electric fan is normally
distributed with a mean 4...
asked 31 minutes ago -
1. A 751 mL NaCl solution is diluted to a volume of 1.06 L and a...
asked 36 minutes ago -
8
A $20,000 face value STRIPS is currently quoted at 38.642 and
has 8 years to...
asked 36 minutes ago -
The current exchange rate between the Japanese yen and
the US dollar is 120 yen per...
asked 38 minutes ago -
Marla’s Massages and More bought a special massage table two
years ago for $9,300. At the...
asked 45 minutes ago -
Suppose you require a peak output voltage of 15.0 V and have
available an AC source...
asked 45 minutes ago