This is Starbuck’s 2019 10-K data. Please make a common size balance sheet and a common size income statement. Thank you!


Homework Answers
a) Common-Size Consolidated Income Statement
| 12 months ended: | Sep 29, 2019 | Sep 30, 2018 | Oct 1, 2017 |
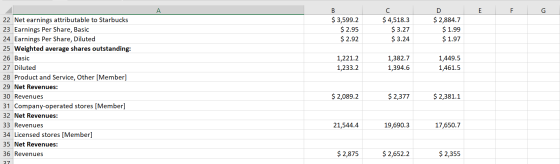
| Company-operated stores | 81.27% | 79.65% | 78.84% |
| Licensed stores | 10.85% | 10.73% | 10.52% |
| Other | 7.88% | 9.62% | 10.64% |
| Net revenues | 100.00% | 100.00% | 100.00% |
| Cost of sales including occupancy costs | -32.17% | -41.16% | -40.37% |
| Gross profit | 67.83% | 58.84% | 59.63% |
| Store operating expenses | -39.59% | -29.10% | -29.01% |
| Other operating expenses | -1.40% | -2.18% | -2.47% |
| Depreciation and amortization expenses | -5.20% | -5.04% | -4.52% |
| General and administrative expenses | -6.88% | -7.12% | -6.22% |
| Restructuring and impairments | -0.51% | -0.91% | -0.69% |
| Litigation credit | — | — | — |
| Income from equity investees | 1.12% | 1.22% | 1.75% |
| Operating income | 15.38% | 15.71% | 18.47% |
| Gain resulting from acquisition of joint venture | — | 5.57% | — |
| Net gain resulting from divestiture of certain operations | 2.35% | 2.02% | 0.42% |
| Loss on extinguishment of debt | — | — | — |
| Interest income and other, net | 0.36% | 0.77% | 0.81% |
| Interest expense | -1.25% | -0.69% | -0.41% |
| Earnings before income taxes | 16.85% | 23.38% | 19.29% |
| Income tax expense | -3.29% | -5.11% | -6.40% |
| Net earnings including noncontrolling interests | 13.56% | 18.28% | 12.89% |
| Net (earnings) loss attributable to noncontrolling interests | 0.02% | — | — |
| Net earnings attributable to Starbucks | 13.58% | 18.28% | 12.89% |

b) Common-Size Consolidated Balance Sheet: Assets
| Sep 29, 2019 | Sep 30, 2018 | Oct 1, 2017 | |
| Cash and cash equivalents | 13.98% | 36.25% | 17.14% |
| Short-term investments | 0.37% | 0.75% | 1.59% |
| Accounts receivable, net | 4.57% | 2.87% | 6.06% |
| Inventories | 7.96% | 5.80% | 9.49% |
| Income tax receivable | 0.73% | 3.96% | 0.47% |
| Other prepaid expenses and current assets | 1.81% | 2.10% | 2.02% |
| Prepaid expenses and current assets | 2.54% | 6.06% | 2.49% |
| Deferred income taxes, net | — | — | — |
| Current assets | 29.42% | 51.72% | 36.78% |
| Long-term investments | 1.14% | 1.11% | 3.77% |
| Equity method investments | 1.75% | 1.23% | 3.01% |
| Other investments | 0.31% | 0.16% | 0.34% |
| Equity investments | 2.06% | 1.39% | 3.35% |
| Property, plant and equipment, net | 33.46% | 24.54% | 34.25% |
| Deferred income taxes, net | 9.19% | 0.56% | 5.54% |
| Other long-term assets | 2.50% | 1.71% | 2.53% |
| Other intangible assets | 4.07% | 4.31% | 3.07% |
| Goodwill | 18.16% | 14.66% | 10.71% |
| Long-term assets | 70.58% | 48.28% | 63.22% |
| Total assets | 100.00% | 100.00% | 100.00% |

Common-size Consolidated Balance Sheet: Liabilities and Stockholders’ Equity
| Sep 29, 2019 | Sep 30, 2018 | Oct 1, 2017 | |
| Accounts payable | 6.19% | 4.88% | 5.45% |
| Accrued occupancy costs | 0.92% | 0.68% | 1.05% |
| Accrued dividends payable | 2.53% | 1.84% | 2.99% |
| Accrued capital and other operating expenditures | 3.66% | 3.09% | 4.19% |
| Self insurance reserves | 1.10% | 0.88% | 1.50% |
| Accrued business taxes | 0.92% | 0.76% | 1.58% |
| Accrued liabilities | 9.12% | 7.25% | 11.31% |
| Accrued payroll and benefits | 3.46% | 2.72% | 3.65% |
| Income taxes payable | 6.72% | 0.43% | — |
| Stored value card liability and current portion of deferred revenue | 6.60% | 6.80% | 8.97% |
| Current portion of long-term debt | — | 1.45% | — |
| Current liabilities | 32.10% | 23.53% | 29.38% |
| Long-term debt, excluding current portion | 58.10% | 37.63% | 27.38% |
| Deferred revenue | 35.09% | 28.05% | 0.03% |
| Other long-term liabilities | 7.13% | 5.92% | 5.23% |
| Long-term liabilities | 100.32% | 71.60% | 32.63% |
| Total liabilities | 132.42% | 95.13% | 62.01% |
| Common stock; $0.001 par value | 0.01% | 0.01% | 0.01% |
| Additional paid-in capital | 0.21% | 0.17% | 0.29% |
| Retained earnings (deficit) | -30.03% | 6.03% | 38.73% |
| Accumulated other comprehensive income (loss) | -2.62% | -1.37% | -1.08% |
| Shareholders’ equity (deficit) | -32.43% | 4.84% | 37.94% |
| Noncontrolling interests | 0.01% | 0.03% | 0.05% |
| Total equity (deficit) | -32.42% | 4.87% | 37.99% |
| Total liabilities and equity (deficit) | 100.00% | 100.00% | 100.00% |
Dear Student, if you like this answer, be sure to send in a thumbs up :D
Add Answer to:
This is Starbuck’s 2019 10-K data. Please make a common size
balance sheet and a common...
Calculate the following financial ratios for fiscal year 2018 only using the "Consolidated Statements of Earn"...
 Calculate the following financial ratios for fiscal year 2018
only using the "Consolidated Statements of Earn" and "Consolidated
Balance Sheets" worksheets in Starbucks 2017 and 2018 Annual
Financial Statements : Current Ratio, Cash Ratio, Inventory
Turnover, Days Sales in Inventory, Long Term Debt Ratio, Times
Interest Earned, Gross Profit Margin, Net Profit Margin, Return on
Equity, Return on Assets.
12 Months Ended Oct. 01, 2017 Sep. 30, 2018 Oct. 02, 2016 $ 22,386.8 9,034,3 6,493.3 500.3 1,011.4 1,450.7 153.5 18,643.5...
Calculate the following financial ratios for fiscal year 2018
only using the "Consolidated Statements of Earn" and "Consolidated
Balance Sheets" worksheets in Starbucks 2017 and 2018 Annual
Financial Statements : Current Ratio, Cash Ratio, Inventory
Turnover, Days Sales in Inventory, Long Term Debt Ratio, Times
Interest Earned, Gross Profit Margin, Net Profit Margin, Return on
Equity, Return on Assets.
12 Months Ended Oct. 01, 2017 Sep. 30, 2018 Oct. 02, 2016 $ 22,386.8 9,034,3 6,493.3 500.3 1,011.4 1,450.7 153.5 18,643.5...
Calculate the following financial ratios for fiscal year 2018 only using the "Consolidated Statements of Earn"...
 Calculate the following financial ratios for fiscal year 2018
only using the "Consolidated Statements of Earn" and "Consolidated
Balance Sheets" worksheets in Starbucks 2017 and 2018 Annual
Financial Statements: Current Ratio, Cash Ratio, Inventory
Turnover, Days Sales in Inventory, Long Term Debt Ratio, Times
Interest Earned, Gross Profit Margin, Net Profit Margin, Return on
Equity, Return on Assets.
12 Months Ended Oct. 01, 2017 Sep. 30, 2018 Oct. 02, 2016 $ 22,386.8 9,034,3 6,493.3 500.3 1,011.4 1,450.7 153.5 18,643.5 $...
Calculate the following financial ratios for fiscal year 2018
only using the "Consolidated Statements of Earn" and "Consolidated
Balance Sheets" worksheets in Starbucks 2017 and 2018 Annual
Financial Statements: Current Ratio, Cash Ratio, Inventory
Turnover, Days Sales in Inventory, Long Term Debt Ratio, Times
Interest Earned, Gross Profit Margin, Net Profit Margin, Return on
Equity, Return on Assets.
12 Months Ended Oct. 01, 2017 Sep. 30, 2018 Oct. 02, 2016 $ 22,386.8 9,034,3 6,493.3 500.3 1,011.4 1,450.7 153.5 18,643.5 $...
Calculate the following financial ratios for fiscal year 2018 only using the "Consolidated Statements of Earn"...
 Calculate the following financial ratios for fiscal year 2018
only using the "Consolidated Statements of Earn" and "Consolidated
Balance Sheets" worksheets in Starbucks 2017 and 2018 Annual
Financial Statements : Current Ratio, Cash Ratio, Inventory
Turnover, Days Sales in Inventory, Long Term Debt Ratio, Times
Interest Earned, Gross Profit Margin, Net Profit Margin, Return on
Equity, Return on Assets.
12 Months Ended Oct. 01, 2017 Sep. 30, 2018 Oct. 02, 2016 $ 22,386.8 9,034,3 6,493.3 500.3 1,011.4 1,450.7 153.5 18,643.5...
Calculate the following financial ratios for fiscal year 2018
only using the "Consolidated Statements of Earn" and "Consolidated
Balance Sheets" worksheets in Starbucks 2017 and 2018 Annual
Financial Statements : Current Ratio, Cash Ratio, Inventory
Turnover, Days Sales in Inventory, Long Term Debt Ratio, Times
Interest Earned, Gross Profit Margin, Net Profit Margin, Return on
Equity, Return on Assets.
12 Months Ended Oct. 01, 2017 Sep. 30, 2018 Oct. 02, 2016 $ 22,386.8 9,034,3 6,493.3 500.3 1,011.4 1,450.7 153.5 18,643.5...
create an excel file with worksheet named ratio. attached in the first picthrw is consolidated statement...
 create an excel file with worksheet named ratio.
attached in the first picthrw is consolidated statement of
earn and in the second pic consolidated balance sheets.
thank you!
need it asap
А 12 Months Ended Oct. 01, 2017 Oct 02, 2016 Sep 30, 2018 $ 22,386.8 9,034.3 6,493.3 500.3 1,011.4 1,450.7 153.5 18,643.5 391.4 4,134.7 1 Consolidated Statements of Earnings - USD ($) shares in Millions, $ in Millions 2 3 Net Revenues 4 Revenues 5 Cost of sales including...
create an excel file with worksheet named ratio.
attached in the first picthrw is consolidated statement of
earn and in the second pic consolidated balance sheets.
thank you!
need it asap
А 12 Months Ended Oct. 01, 2017 Oct 02, 2016 Sep 30, 2018 $ 22,386.8 9,034.3 6,493.3 500.3 1,011.4 1,450.7 153.5 18,643.5 391.4 4,134.7 1 Consolidated Statements of Earnings - USD ($) shares in Millions, $ in Millions 2 3 Net Revenues 4 Revenues 5 Cost of sales including...
please complete the balance sheet. Analyzing, Forecasting, and Interpreting Both Income Statement and Balance Sheet Following...
 please complete the balance sheet.
Analyzing, Forecasting, and Interpreting Both Income Statement and Balance Sheet Following are the income statements and balance sheets of General Mills, Inc. Income Statement, Fiscal Years Ended ($ millions) May 29, 2011 May 30, 2010 Net Sales $ 14,880.2 $ 14,635.6 Cost of sales 8,926.7 8,835,4 Selling general and administrative expenses 3.192.0 3,162.7 Divestitures (gain), net (17.4) Restructuring, impairment, and other exit costs 4.4 31.4 Operating income 2.606.1 Interest, net 401.6 Earnings before income tax...
please complete the balance sheet.
Analyzing, Forecasting, and Interpreting Both Income Statement and Balance Sheet Following are the income statements and balance sheets of General Mills, Inc. Income Statement, Fiscal Years Ended ($ millions) May 29, 2011 May 30, 2010 Net Sales $ 14,880.2 $ 14,635.6 Cost of sales 8,926.7 8,835,4 Selling general and administrative expenses 3.192.0 3,162.7 Divestitures (gain), net (17.4) Restructuring, impairment, and other exit costs 4.4 31.4 Operating income 2.606.1 Interest, net 401.6 Earnings before income tax...
please do the balance sheet. information on photo #2 continues on photo #3 and so on....
 please do the balance sheet.
information on photo #2 continues on photo #3 and so on. everything
is captured.
Analyzing, Forecasting, and Interpreting Both Income Statement and Balance Sheet Following are the income statements and balance sheets of General Mills, Inc. Income Statement Fiscal Years Ended ($ millions) Net Sales Cost of sales Selling general and administrative expenses Divestitures (gain). net Restructuring, impairment and other exit costs Operating income Interest, net Earnings before income tax expense and equity in income...
please do the balance sheet.
information on photo #2 continues on photo #3 and so on. everything
is captured.
Analyzing, Forecasting, and Interpreting Both Income Statement and Balance Sheet Following are the income statements and balance sheets of General Mills, Inc. Income Statement Fiscal Years Ended ($ millions) Net Sales Cost of sales Selling general and administrative expenses Divestitures (gain). net Restructuring, impairment and other exit costs Operating income Interest, net Earnings before income tax expense and equity in income...
Analyzing, Forecasting, and Interpreting Both Income Statement and Balance Sheet Following are the income statements and...
 Analyzing, Forecasting, and Interpreting Both Income Statement and Balance Sheet Following are the income statements and balance sheets of General Mills, Inc. Income Statement, Fiscal Years Ended ($ millions) May 29, 2011 May 30, 2010 Net Sales $ 14,880.2 $ 14,635.6 Cost of sales 8,926.7 8,835,4 Selling general and administrative expenses 3.192.0 3,162.7 Divestitures (gain), net (17.4) Restructuring, impairment, and other exit costs 4.4 31.4 Operating income 2.606.1 Interest, net 401.6 Earnings before income tax expense and equity in income...
Analyzing. Forecasting, and Interpreting Income Statement and Balance Sheet Following are the income statement and balance...
 Analyzing. Forecasting, and Interpreting Income Statement and Balance Sheet Following are the income statement and balance sheet of General Mills, Inc. Income Statement, Fiscal Years Ended (in s millions) May 26, 2013 May 27, 2012 May 29, 2011 Net Sales $16.657.9 $14.380 2 Cost of Sales 11.350.2 10.613.2 892 Selling general and administrative expenses 3.5523 3.380.7 2. 1920 Divestitures (gain) Restructuring impairment, and other exit costs 101.6 Operating profit 2851.8 2562.4 27745 net 351.9 Earnings before income taxes and after...
ratios for consolidated balance sheet Starbucks how do i solve for the ratio template? Consolidated Statements...
 ratios for consolidated balance sheet Starbucks
how
do i solve for the ratio template?
Consolidated Statements of Earn Consolidated Balance Sheets Ratios Template Sep 30, 2018 O . 2017 Consolidated Balance Sheets - USD (S) Sin Millions Current Cash and cash equivalents Short-term in Prepaid Expand Other Ass, Cut Equity and cost investments Property, plant and equipment Deferred income Other long-term acts Other intangible assets TOTAL ASSETS Accued liabili Stowalue and liability Current pro long-term de Long-term debe Deed Revenue...
ratios for consolidated balance sheet Starbucks
how
do i solve for the ratio template?
Consolidated Statements of Earn Consolidated Balance Sheets Ratios Template Sep 30, 2018 O . 2017 Consolidated Balance Sheets - USD (S) Sin Millions Current Cash and cash equivalents Short-term in Prepaid Expand Other Ass, Cut Equity and cost investments Property, plant and equipment Deferred income Other long-term acts Other intangible assets TOTAL ASSETS Accued liabili Stowalue and liability Current pro long-term de Long-term debe Deed Revenue...
 Calculate the following financial ratios for fiscal year 2018
only using the "Consolidated Statements of Earn" and "Consolidated
Balance Sheets" worksheets in Starbucks 2017 and 2018 Annual
Financial Statements : Current Ratio, Cash Ratio, Inventory
Turnover, Days Sales in Inventory, Long Term Debt Ratio, Times
Interest Earned, Gross Profit Margin, Net Profit Margin, Return on
Equity, Return on Assets.
12 Months Ended Oct. 01, 2017 Sep. 30, 2018 Oct. 02, 2016 $ 22,386.8 9,034,3 6,493.3 500.3 1,011.4 1,450.7 153.5 18,643.5...
Calculate the following financial ratios for fiscal year 2018
only using the "Consolidated Statements of Earn" and "Consolidated
Balance Sheets" worksheets in Starbucks 2017 and 2018 Annual
Financial Statements : Current Ratio, Cash Ratio, Inventory
Turnover, Days Sales in Inventory, Long Term Debt Ratio, Times
Interest Earned, Gross Profit Margin, Net Profit Margin, Return on
Equity, Return on Assets.
12 Months Ended Oct. 01, 2017 Sep. 30, 2018 Oct. 02, 2016 $ 22,386.8 9,034,3 6,493.3 500.3 1,011.4 1,450.7 153.5 18,643.5...
 Calculate the following financial ratios for fiscal year 2018
only using the "Consolidated Statements of Earn" and "Consolidated
Balance Sheets" worksheets in Starbucks 2017 and 2018 Annual
Financial Statements: Current Ratio, Cash Ratio, Inventory
Turnover, Days Sales in Inventory, Long Term Debt Ratio, Times
Interest Earned, Gross Profit Margin, Net Profit Margin, Return on
Equity, Return on Assets.
12 Months Ended Oct. 01, 2017 Sep. 30, 2018 Oct. 02, 2016 $ 22,386.8 9,034,3 6,493.3 500.3 1,011.4 1,450.7 153.5 18,643.5 $...
Calculate the following financial ratios for fiscal year 2018
only using the "Consolidated Statements of Earn" and "Consolidated
Balance Sheets" worksheets in Starbucks 2017 and 2018 Annual
Financial Statements: Current Ratio, Cash Ratio, Inventory
Turnover, Days Sales in Inventory, Long Term Debt Ratio, Times
Interest Earned, Gross Profit Margin, Net Profit Margin, Return on
Equity, Return on Assets.
12 Months Ended Oct. 01, 2017 Sep. 30, 2018 Oct. 02, 2016 $ 22,386.8 9,034,3 6,493.3 500.3 1,011.4 1,450.7 153.5 18,643.5 $...
 Calculate the following financial ratios for fiscal year 2018
only using the "Consolidated Statements of Earn" and "Consolidated
Balance Sheets" worksheets in Starbucks 2017 and 2018 Annual
Financial Statements : Current Ratio, Cash Ratio, Inventory
Turnover, Days Sales in Inventory, Long Term Debt Ratio, Times
Interest Earned, Gross Profit Margin, Net Profit Margin, Return on
Equity, Return on Assets.
12 Months Ended Oct. 01, 2017 Sep. 30, 2018 Oct. 02, 2016 $ 22,386.8 9,034,3 6,493.3 500.3 1,011.4 1,450.7 153.5 18,643.5...
Calculate the following financial ratios for fiscal year 2018
only using the "Consolidated Statements of Earn" and "Consolidated
Balance Sheets" worksheets in Starbucks 2017 and 2018 Annual
Financial Statements : Current Ratio, Cash Ratio, Inventory
Turnover, Days Sales in Inventory, Long Term Debt Ratio, Times
Interest Earned, Gross Profit Margin, Net Profit Margin, Return on
Equity, Return on Assets.
12 Months Ended Oct. 01, 2017 Sep. 30, 2018 Oct. 02, 2016 $ 22,386.8 9,034,3 6,493.3 500.3 1,011.4 1,450.7 153.5 18,643.5...
 create an excel file with worksheet named ratio.
attached in the first picthrw is consolidated statement of
earn and in the second pic consolidated balance sheets.
thank you!
need it asap
А 12 Months Ended Oct. 01, 2017 Oct 02, 2016 Sep 30, 2018 $ 22,386.8 9,034.3 6,493.3 500.3 1,011.4 1,450.7 153.5 18,643.5 391.4 4,134.7 1 Consolidated Statements of Earnings - USD ($) shares in Millions, $ in Millions 2 3 Net Revenues 4 Revenues 5 Cost of sales including...
create an excel file with worksheet named ratio.
attached in the first picthrw is consolidated statement of
earn and in the second pic consolidated balance sheets.
thank you!
need it asap
А 12 Months Ended Oct. 01, 2017 Oct 02, 2016 Sep 30, 2018 $ 22,386.8 9,034.3 6,493.3 500.3 1,011.4 1,450.7 153.5 18,643.5 391.4 4,134.7 1 Consolidated Statements of Earnings - USD ($) shares in Millions, $ in Millions 2 3 Net Revenues 4 Revenues 5 Cost of sales including...
 please complete the balance sheet.
Analyzing, Forecasting, and Interpreting Both Income Statement and Balance Sheet Following are the income statements and balance sheets of General Mills, Inc. Income Statement, Fiscal Years Ended ($ millions) May 29, 2011 May 30, 2010 Net Sales $ 14,880.2 $ 14,635.6 Cost of sales 8,926.7 8,835,4 Selling general and administrative expenses 3.192.0 3,162.7 Divestitures (gain), net (17.4) Restructuring, impairment, and other exit costs 4.4 31.4 Operating income 2.606.1 Interest, net 401.6 Earnings before income tax...
please complete the balance sheet.
Analyzing, Forecasting, and Interpreting Both Income Statement and Balance Sheet Following are the income statements and balance sheets of General Mills, Inc. Income Statement, Fiscal Years Ended ($ millions) May 29, 2011 May 30, 2010 Net Sales $ 14,880.2 $ 14,635.6 Cost of sales 8,926.7 8,835,4 Selling general and administrative expenses 3.192.0 3,162.7 Divestitures (gain), net (17.4) Restructuring, impairment, and other exit costs 4.4 31.4 Operating income 2.606.1 Interest, net 401.6 Earnings before income tax...
 please do the balance sheet.
information on photo #2 continues on photo #3 and so on. everything
is captured.
Analyzing, Forecasting, and Interpreting Both Income Statement and Balance Sheet Following are the income statements and balance sheets of General Mills, Inc. Income Statement Fiscal Years Ended ($ millions) Net Sales Cost of sales Selling general and administrative expenses Divestitures (gain). net Restructuring, impairment and other exit costs Operating income Interest, net Earnings before income tax expense and equity in income...
please do the balance sheet.
information on photo #2 continues on photo #3 and so on. everything
is captured.
Analyzing, Forecasting, and Interpreting Both Income Statement and Balance Sheet Following are the income statements and balance sheets of General Mills, Inc. Income Statement Fiscal Years Ended ($ millions) Net Sales Cost of sales Selling general and administrative expenses Divestitures (gain). net Restructuring, impairment and other exit costs Operating income Interest, net Earnings before income tax expense and equity in income...
 Analyzing, Forecasting, and Interpreting Both Income Statement and Balance Sheet Following are the income statements and balance sheets of General Mills, Inc. Income Statement, Fiscal Years Ended ($ millions) May 29, 2011 May 30, 2010 Net Sales $ 14,880.2 $ 14,635.6 Cost of sales 8,926.7 8,835,4 Selling general and administrative expenses 3.192.0 3,162.7 Divestitures (gain), net (17.4) Restructuring, impairment, and other exit costs 4.4 31.4 Operating income 2.606.1 Interest, net 401.6 Earnings before income tax expense and equity in income...
 Analyzing. Forecasting, and Interpreting Income Statement and Balance Sheet Following are the income statement and balance sheet of General Mills, Inc. Income Statement, Fiscal Years Ended (in s millions) May 26, 2013 May 27, 2012 May 29, 2011 Net Sales $16.657.9 $14.380 2 Cost of Sales 11.350.2 10.613.2 892 Selling general and administrative expenses 3.5523 3.380.7 2. 1920 Divestitures (gain) Restructuring impairment, and other exit costs 101.6 Operating profit 2851.8 2562.4 27745 net 351.9 Earnings before income taxes and after...
 ratios for consolidated balance sheet Starbucks
how
do i solve for the ratio template?
Consolidated Statements of Earn Consolidated Balance Sheets Ratios Template Sep 30, 2018 O . 2017 Consolidated Balance Sheets - USD (S) Sin Millions Current Cash and cash equivalents Short-term in Prepaid Expand Other Ass, Cut Equity and cost investments Property, plant and equipment Deferred income Other long-term acts Other intangible assets TOTAL ASSETS Accued liabili Stowalue and liability Current pro long-term de Long-term debe Deed Revenue...
ratios for consolidated balance sheet Starbucks
how
do i solve for the ratio template?
Consolidated Statements of Earn Consolidated Balance Sheets Ratios Template Sep 30, 2018 O . 2017 Consolidated Balance Sheets - USD (S) Sin Millions Current Cash and cash equivalents Short-term in Prepaid Expand Other Ass, Cut Equity and cost investments Property, plant and equipment Deferred income Other long-term acts Other intangible assets TOTAL ASSETS Accued liabili Stowalue and liability Current pro long-term de Long-term debe Deed Revenue...
Most questions answered within 3 hours.
-
Please explain steps:
An 80 kg swimmer steps off a platform 10 m above the water...
asked 4 minutes ago -
A lottery exists where balls numbered 1 to 17 are placed in an
urn. To win,...
asked 7 minutes ago -
26) Briefly describe, using words or simple diagrams, the
chemiosmotic theory for coupling oxidation to phosphorylation...
asked 2 hours ago -
Suppose that XX is a random variable with mean 16 and standard
deviation 5 . Also...
asked 2 hours ago -
Calculate the number density of argon gas at a temperature of
24C and a pressure of...
asked 6 hours ago -
Alternative
Classification
How to Estimate
Probabilities from Data? ( For continuous Attributes)
And How to generate...
asked 6 hours ago -
An explosion breaks a 20.0-kg object into three parts. The
object is initially moving at a...
asked 6 hours ago -
Calculate the approximate number of residues of Rubisco, which
is involved in carbon fixation in plants,...
asked 7 hours ago -
Other decisions about scientific claims can have a much broader
impact.ENERGYarrow-10x10.png, environment, health, security - all...
asked 8 hours ago -
I need to write a research paper and work cited about this
topic: The United States...
asked 9 hours ago -
Hello! I was wondering if I could have some help?
If the vapor pressure of carvone...
asked 9 hours ago -
An economist wants to estimate the mean per capita income (in
thousands of dollars) for a...
asked 9 hours ago