


Homework Answers
a) Periodic Inventory System
| FIFO | Cost of Goods Available for Sale | Cost of Goods Sold | Inventory on hand | ||||||
| Activity | Units | Unit Price | Amount | Units | Unit Price | Amount | Units | Unit Price | Amount |
| Beginning Inventory | 110 | $ 9.00 | $ 990 | 110 | $ 9.00 | $ 990 | |||
| Purchases | |||||||||
| April 4 | 420 | $ 9.20 | $ 3,864 | 420 | $ 9.20 | $ 3,864 | |||
| April 11 | 280 | $ 9.30 | $ 2,604 | 260 | $ 9.30 | $ 2,418 | 20 | $ 9.30 | $ 186 |
| April 18 | 210 | $ 9.40 | $ 1,974 | 210 | $ 9.40 | $ 1,974 | |||
| Total | 1020 | $ 9,432 | 790 | $ 7,272 | 230 | $ 2,160 | |||
| LIFO | Cost of Goods Available for Sale | Cost of Goods Sold | Inventory on hand | ||||||
| Activity | Units | Unit Price | Amount | Units | Unit Price | Amount | Units | Unit Price | Amount |
| Beginning Inventory | 110 | $ 9.00 | $ 990 | 110 | $ 9.00 | $ 990 | |||
| Purchases | |||||||||
| April 4 | 420 | $ 9.20 | $ 3,864 | 300 | $ 9.20 | $ 2,760 | 120 | $ 9.20 | $ 1,104 |
| April 11 | 280 | $ 9.30 | $ 2,604 | 280 | $ 9.30 | $ 2,604 | |||
| April 18 | 210 | $ 9.40 | $ 1,974 | 210 | $ 9.40 | $ 1,974 | |||
| Total | 1020 | $ 9,432 | 790 | $ 7,338 | 230 | $ 2,094 | |||
| Average Cost | Cost of Goods Available for Sale | Cost of Goods Sold | Inventory on hand | ||||||
| Activity | Units | Unit Price | Amount | Units | Unit Price | Amount | Units | Unit Price | Amount |
| Beginning Inventory | 110 | $ 9.00 | $ 990 | ||||||
| Purchases | |||||||||
| April 4 | 420 | $ 9.20 | $ 3,864 | ||||||
| April 11 | 280 | $ 9.30 | $ 2,604 | ||||||
| April 18 | 210 | $ 9.40 | $ 1,974 | ||||||
| Total | 1020 | $ 9.25 | $ 9,432 | 790 | $ 9.25 | $ 7,305 | 230 | $ 9.25 | $ 2,128 |
b) Perpetual Inventory System
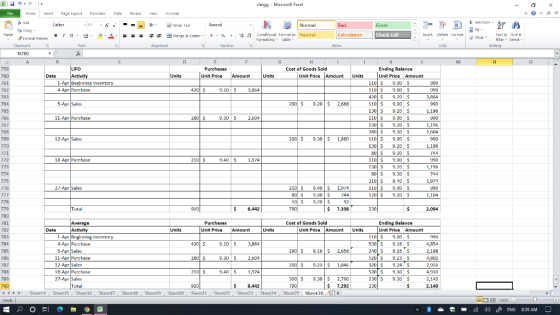
| FIFO | Purchases | Cost of Goods Sold | Ending Balance | |||||||
| Date | Activity | Units | Unit Price | Amount | Units | Unit Price | Amount | Units | Unit Price | Amount |
| 1-Apr | Beginning Inventory | 110 | $ 9.00 | $ 990 | ||||||
| 4-Apr | Purchase | 420 | $ 9.20 | $ 3,864 | 110 | $ 9.00 | $ 990 | |||
| 420 | $ 9.20 | $ 3,864 | ||||||||
| 5-Apr | Sales | 110 | $ 9.00 | $ 990 | ||||||
| 180 | $ 9.20 | $ 1,656 | 240 | $ 9.20 | $ 2,208 | |||||
| 11-Apr | Purchase | 280 | $ 9.30 | $ 2,604 | 240 | $ 9.20 | $ 2,208 | |||
| 280 | $ 9.30 | $ 2,604 | ||||||||
| 12-Apr | Sales | 200 | $ 9.20 | $ 1,840 | 40 | $ 9.20 | $ 368 | |||
| 280 | $ 9.30 | $ 2,604 | ||||||||
| 18-Apr | Purchase | 210 | $ 9.40 | $ 1,974 | 40 | $ 9.20 | $ 368 | |||
| 280 | $ 9.30 | $ 2,604 | ||||||||
| 210 | $ 9.40 | $ 1,974 | ||||||||
| 27-Apr | Sales | 40 | $ 9.20 | $ 368 | ||||||
| 260 | $ 9.30 | $ 2,418 | 20 | $ 9.30 | $ 186 | |||||
| 210 | $ 9.40 | $ 1,974 | ||||||||
| Total | 910 | $ 8,442 | 790 | $ 7,272 | 230 | $ 2,160 | ||||
If you have any query, kindly comment with your query and please
mark thumbs up.
Add Answer to:
questions of a & b
3 4 5 2 Hull Company's record of transactions concerning part...
Hull Company's record of transactions concerning part X for the month of April was as follows....
 Hull Company's record of transactions concerning part X for the month of April was as follows. Purchases Sales Quantity: Unit Cost: Quantity: Apr 1 (Balance on hand) 110 $8.00 Apr 5 290 Apr 4 420 8.20 Apr 12 Apr 11 2808 .30 Apr 27 800 Apr 18 210 8.401 Apr 28 200 Apr 26 500 8.50 Apr 30 2708.70 200 Instructions: 3 (a) Compute the inventory at April 30 and the cost of goods sold during April on each of...
Consider the below matrixA, which you can copy and paste directly into Matlab.
Problem #1: Consider the below matrix A, which you can copy and paste directly into Matlab. The matrix contains 3 columns. The first column consists of Test #1 marks, the second column is Test # 2 marks, and the third column is final exam marks for a large linear algebra course. Each row represents a particular student.A = [36 45 75 81 59 73 77 73 73 65 72 78 65 55 83 73 57 78 84 31 60 83...
Use the Grouped Distribution method for the following exercise (see Self-Test 2-4 for detailed instructions), rounding...
Use the Grouped Distribution method for the following exercise (see Self-Test 2-4 for detailed instructions), rounding each answer to the nearest whole number. Using the frequency distribution below (scores on a statistics exam taken by 80 students), determine:ion 1 of the preliminary test (scores on a statistics exam taken by 80 students), determine: 68 84 75 82 68 90 62 88 76 93 73 79 88 73 60 93 71 59 85 75 61 65 75 87 74 62 95...
Problem 8-4 Headland Company’s record of transactions concerning part X for the month of April was...
 Problem 8-4
Headland Company’s record of transactions concerning part X for the
month of April was as follows.
Purchases
Sales
April 1
(balance on hand)
350
@
$6.60
April 5
550
4
650
@
6.73
12
450
11
550
@
7.00
27
1,300
18
450
@
7.06
28
150
26
850
@
7.39
30
450
@
7.66
Calculate average-cost per unit. Assume that perpetual
inventory records are kept in units only. (Round answer
to 2 decimal places, e.g. 2.76.)
Average-cost...
Problem 8-4
Headland Company’s record of transactions concerning part X for the
month of April was as follows.
Purchases
Sales
April 1
(balance on hand)
350
@
$6.60
April 5
550
4
650
@
6.73
12
450
11
550
@
7.00
27
1,300
18
450
@
7.06
28
150
26
850
@
7.39
30
450
@
7.66
Calculate average-cost per unit. Assume that perpetual
inventory records are kept in units only. (Round answer
to 2 decimal places, e.g. 2.76.)
Average-cost...
Use the accompanying data set on the pulse rates (in beats per minute) of males to...
Use the accompanying data set on the pulse rates (in beats per minute) of males to complete parts (a) and (b) below. LOADING... Click the icon to view the pulse rates of males. a. Find the mean and standard deviation, and verify that the pulse rates have a distribution that is roughly normal. The mean of the pulse rates is 71.871.8 beats per minute. (Round to one decimal place as needed.) The standard deviation of the pulse rates is 12.212.2...
Problem 8-04 Sunland Company's record of transactions concerning part X for the month of April was...
 Problem 8-04 Sunland Company's record of transactions concerning part X for the month of April was as follows. Purchases 1 (balance on hand) April April 320 @ $6.30 620 @ 6.40 520 @ 6.70 420 @ 6.70 820 @ 7.10 420 7.30 Sales 5 520 12 420 27 1,240 29 150 Calculate average-cost per unit. Assume that perpetual inventory records are kept in units only. (Round answer to 4 decimal places, e.g. 2.7682.) Average-cost per units LINK TO TEXT Compute...
1. Forecast demand for Year 4. a. Explain what technique you utilized to forecast your demand....
 1. Forecast demand for Year 4.
a. Explain what technique you utilized to forecast your
demand.
b. Explain why you chose this technique over others.
Year 3 Year 1 Year 2 Actual Actual Actual Forecast Forecast Forecast Demand Demand Demand Week 1 52 57 63 55 66 77 Week 2 49 58 68 69 75 65 Week 3 47 50 58 65 80 74 Week 4 60 53 58 55 78 67 57 Week 5 49 57 64 76 77...
1. Forecast demand for Year 4.
a. Explain what technique you utilized to forecast your
demand.
b. Explain why you chose this technique over others.
Year 3 Year 1 Year 2 Actual Actual Actual Forecast Forecast Forecast Demand Demand Demand Week 1 52 57 63 55 66 77 Week 2 49 58 68 69 75 65 Week 3 47 50 58 65 80 74 Week 4 60 53 58 55 78 67 57 Week 5 49 57 64 76 77...
PRINTER VERSION 8th ed Chapter 03, Section 3.5, Problem 092b The following data give the numbers...
 PRINTER VERSION 8th ed Chapter 03, Section 3.5, Problem 092b The following data give the numbers of computer keyboards assembled at the Twentieth Century Electronics Company for a sample of 25 days. 66 67 68 71 72 72 70 71 7777 78 78 81 79 75 76 76 77 69 69 73 73 73 74 75 Determine the (approximate) value of the 53rd percentile. Round your answer to the nearest integer. 1878 81 79 75 76 76 77 606 The...
Use this set of 40 exam scores as the POPULATION for this activity: (put them into...
Use this set of 40 exam scores as the POPULATION for this activity: (put them into List 1 in your calculator) 67 90 74 66 76 79 77 53 86 86 68 81 72 57 79 78 50 66 77 66 81 79 80 73 71 56 81 86 62 69 81 78 77 80 88 62 67 62 74 94 Use this set of 40 exam scores as the POPULATION for this activity: (put them into List 1 in...
 Hull Company's record of transactions concerning part X for the month of April was as follows. Purchases Sales Quantity: Unit Cost: Quantity: Apr 1 (Balance on hand) 110 $8.00 Apr 5 290 Apr 4 420 8.20 Apr 12 Apr 11 2808 .30 Apr 27 800 Apr 18 210 8.401 Apr 28 200 Apr 26 500 8.50 Apr 30 2708.70 200 Instructions: 3 (a) Compute the inventory at April 30 and the cost of goods sold during April on each of...
 Problem 8-4
Headland Company’s record of transactions concerning part X for the
month of April was as follows.
Purchases
Sales
April 1
(balance on hand)
350
@
$6.60
April 5
550
4
650
@
6.73
12
450
11
550
@
7.00
27
1,300
18
450
@
7.06
28
150
26
850
@
7.39
30
450
@
7.66
Calculate average-cost per unit. Assume that perpetual
inventory records are kept in units only. (Round answer
to 2 decimal places, e.g. 2.76.)
Average-cost...
Problem 8-4
Headland Company’s record of transactions concerning part X for the
month of April was as follows.
Purchases
Sales
April 1
(balance on hand)
350
@
$6.60
April 5
550
4
650
@
6.73
12
450
11
550
@
7.00
27
1,300
18
450
@
7.06
28
150
26
850
@
7.39
30
450
@
7.66
Calculate average-cost per unit. Assume that perpetual
inventory records are kept in units only. (Round answer
to 2 decimal places, e.g. 2.76.)
Average-cost...
 Problem 8-04 Sunland Company's record of transactions concerning part X for the month of April was as follows. Purchases 1 (balance on hand) April April 320 @ $6.30 620 @ 6.40 520 @ 6.70 420 @ 6.70 820 @ 7.10 420 7.30 Sales 5 520 12 420 27 1,240 29 150 Calculate average-cost per unit. Assume that perpetual inventory records are kept in units only. (Round answer to 4 decimal places, e.g. 2.7682.) Average-cost per units LINK TO TEXT Compute...
 1. Forecast demand for Year 4.
a. Explain what technique you utilized to forecast your
demand.
b. Explain why you chose this technique over others.
Year 3 Year 1 Year 2 Actual Actual Actual Forecast Forecast Forecast Demand Demand Demand Week 1 52 57 63 55 66 77 Week 2 49 58 68 69 75 65 Week 3 47 50 58 65 80 74 Week 4 60 53 58 55 78 67 57 Week 5 49 57 64 76 77...
1. Forecast demand for Year 4.
a. Explain what technique you utilized to forecast your
demand.
b. Explain why you chose this technique over others.
Year 3 Year 1 Year 2 Actual Actual Actual Forecast Forecast Forecast Demand Demand Demand Week 1 52 57 63 55 66 77 Week 2 49 58 68 69 75 65 Week 3 47 50 58 65 80 74 Week 4 60 53 58 55 78 67 57 Week 5 49 57 64 76 77...
 PRINTER VERSION 8th ed Chapter 03, Section 3.5, Problem 092b The following data give the numbers of computer keyboards assembled at the Twentieth Century Electronics Company for a sample of 25 days. 66 67 68 71 72 72 70 71 7777 78 78 81 79 75 76 76 77 69 69 73 73 73 74 75 Determine the (approximate) value of the 53rd percentile. Round your answer to the nearest integer. 1878 81 79 75 76 76 77 606 The...
Most questions answered within 3 hours.
-
An short-seller in Tesla is worried the latest management
earnings forecast is too aggressive and the...
asked 38 minutes ago -
Question 3 (1 point)
Fill in the blank. Speed Car Rental company found that the tire...
asked 38 minutes ago -
1. A copper wire is 26.61 cm long and weighs 1.265 g. The
density of copper...
asked 15 minutes ago -
Remember that a concept sketch consists of a sketch (or
series of sketches), labels, and complete...
asked 18 minutes ago -
on a newly discovered planet, the period of a pendulum with a
length of 2 m...
asked 20 minutes ago -
Why [M(CN)6] is not organometallic even it has metal
to carbon bond too
asked 26 minutes ago -
mstar electric has a bond issue outstanding that has a 20 year
life, a $1,000 par...
asked 34 minutes ago -
This is a Business Writing Question:
Common Types of Faulty Sentence Logic:
A. Mixed constructions
B....
asked 34 minutes ago -
Skinner asserts that science, and the common view of science, has
been tarnished. Explain his evidence...
asked 37 minutes ago -
A grocery store's receipts show that Sunday customer purchases
have a skewed distribution with a mean...
asked 44 minutes ago -
A 0.035 mol sample of a weak acid, HA, is dissolved in 437 mL of
water...
asked 55 minutes ago -
a sample of Ar gas has a volume of 6.30 L with an unknown
pressure. the...
asked 56 minutes ago