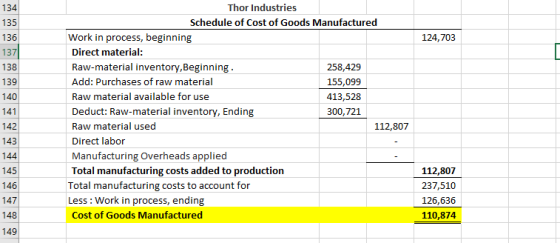
Compute Cost of Goods Manufactured for Thor Industries for the Fiscal Year ended 7/31/19. Hint: You don't have enough data to solve this by analyzing the WIP account. You'll have to find another way - by analyzing another account. Show all your calculations.


Homework Answers
Add Answer to:
Compute Cost of Goods Manufactured for Thor Industries for the
Fiscal Year ended 7/31/19. Hint: You...
Compute Cost of Goods Manufactured for Thor Industries for the Fiscal Year ended 7/31/19. Hint: You...
 Compute Cost of Goods Manufactured for Thor Industries for the
Fiscal Year ended 7/31/19. Hint: You don't have enough data to
solve this by analyzing the WIP account. You'll have to find
another way - by analyzing another account. Show all your
calculations.
sheet differ from or be similar to Thor Industries? Question 4: Compute Cost of Goods Manufactured for Thor Industries for the fiscal year ended 7/31/19. Hint: You don't have enough data to solve this by analyzing the...
Compute Cost of Goods Manufactured for Thor Industries for the
Fiscal Year ended 7/31/19. Hint: You don't have enough data to
solve this by analyzing the WIP account. You'll have to find
another way - by analyzing another account. Show all your
calculations.
sheet differ from or be similar to Thor Industries? Question 4: Compute Cost of Goods Manufactured for Thor Industries for the fiscal year ended 7/31/19. Hint: You don't have enough data to solve this by analyzing the...
Greenfern Corporation Income Statement for the Fiscal Year Ended July 31, 2014 Net sales $62,983 Cost...
Greenfern Corporation Income Statement for the Fiscal Year Ended July 31, 2014 Net sales $62,983 Cost of products sold 44,799 Gross profit $18,184 Selling, general, and administrative expenses 8,026 Depreciation 912 Operating income (loss) $9,246 Interest expense 558 Earnings (loss) before income taxes $8,688 Income taxes 3,041 Net earnings (loss) $5,647 Greenfern Corporation Balance Sheet as of July 31, 2014 Assets Liabilities and Stockholders’ Equity Cash and marketable securities $6,930 Accounts payable $4,848 Accounts receivable 6,746 Accrued and other liabilities...
Compute the overall profit margin percentage for Dick's Sporting Goods for the FY 2018 (the year...
 Compute the overall profit margin percentage for Dick's Sporting
Goods for the FY 2018 (the year ended Feb. 2, 2019). Show your
answer as a percentage, including 3 decimal points, e.g., 5/26 =
19.231 (percent).
Compute the Return on Assets for Dick's Sporting Goods for
fiscal year 2018 (the year ended Feb. 2, 2019). Show your answer as
a percentage to 3 decimal points, e.g., 5/26 = 19.231 (%).
What percentage of Dick's Sporting Good's Gross Goodwill had
been impaired...
Compute the overall profit margin percentage for Dick's Sporting
Goods for the FY 2018 (the year ended Feb. 2, 2019). Show your
answer as a percentage, including 3 decimal points, e.g., 5/26 =
19.231 (percent).
Compute the Return on Assets for Dick's Sporting Goods for
fiscal year 2018 (the year ended Feb. 2, 2019). Show your answer as
a percentage to 3 decimal points, e.g., 5/26 = 19.231 (%).
What percentage of Dick's Sporting Good's Gross Goodwill had
been impaired...
CRUZ, INC. Income Statement For Year Ended December 31, 2017 Sales $488,000 Cost of goods sold...
 CRUZ, INC. Income Statement For Year Ended December 31, 2017 Sales $488,000 Cost of goods sold 314,000 Gross profit 174,000 Operating expenses Depreciation expense $37,600 Other expenses 89,100 126,700 Income before taxes 47,300 Income taxes expense 17,300 Net income $ 30,000 CRUZ, INC. Comparative Balance Sheets December 31, 2017 | 2017 2016 _ Assets Cash $ 94,800 $ 24,000 Accounts receivable, net 41,000 51,000 Inventory 85,800 95,800 Prepaid expenses 5,400 4,200 Total current assets 227,000 175,000 Furniture 109,000 119,000 Accum....
Ivanhoe Company Income Statement For the Year Ended December 31, 2022 Net sales Cost of goods...
 Ivanhoe Company Income Statement For the Year Ended December 31, 2022 Net sales Cost of goods sold Selling and administrative expenses Interest expense Income tax expense Net income $2,221,500 1,020,000 903,500 75,000 72,000 $ 151,000 Ivanhoe Company Balance Sheet December 31, 2022 Assets Current assets Cash Debt investments Accounts receivable (net) Inventory Total current assets Plant assets (net) Total assets Liabilities and Stockholders' Equity Current liabilities Accounts payable $ 60,300 83,000 169,900 266,500 579,700 571,500 $ 1,151,200 $ 151,000 acy...
Sandhill Co. Income Statement For the Year Ended December 31, 2022 Net sales Cost of goods...
 Sandhill Co. Income Statement For the Year Ended December 31, 2022 Net sales Cost of goods sold $2,225,500 1,010,000 900,000 81,000 Selling and administrative expenses Interest expense Income tax expense 73,500 Net income $ 161,000 Sandhill Co. Balance Sheet December 31, 2022 Assets Current assets Cash $ 56,100 Debt investments 83,000 Accounts receivable (net) 169,600 Inventory 206,300 Total current assets 515,000 Plant assets (net) 573,500 Total assets $ 1,088,500 Liabilities and Stockholders' Equity PLUUUUU Liabilities and Stockholders' Equity Current liabilities...
Burch Industries Consolidated Income Statements (in thousands, except per share data) Year ended December 31, 2019...
 Burch Industries Consolidated Income Statements (in thousands, except per share data) Year ended December 31, 2019 2017 2018 $3,405,211 Revenues $3,930,984 $3,003,610 Costs and expenses: Cost of goods sold Selling and administrative $2,386,993 $2,089,089 $1,850,530 922,261 761,498 30,665 Interest 25,739 664,061 27,316 (43) Other expenses (income) 1,475 2,141 Total costs and expenses $3,336,468 $2,883,393 $2,541,864 Income before income taxes $594,516 $521,818 $461,746 Income taxes 229,500 192,600 174,700 Net income $365,016 $329,218 $287,046 Burch Industries Consolidated Balance Sheets (in thousands) December...
Occidental Industries Income Statement for the Year Ended December 31, 2019 200,000 106,000 Sales revenue Less:...
 Occidental Industries Income Statement for the Year Ended December 31, 2019 200,000 106,000 Sales revenue Less: Cost of goods sold Gross profits Less: Operating expenses Selling expense General and administrative expenses Lease expense Depreciation expense Total operating expense Operating profits Less: Interest expense Net profits before taxes Less: Taxes Net profits after taxes 16,000 10,000 1,000 10,000 6,100 4,360 Occidendatal Industries Balance Sheet December 31, 2019 Assets Cash 43,500 Marketable securities 1,000 Accounts receivable 25,000 Inventories 45,500 Total current assets...
Listed below are account balances for Accounts Company for the fiscal year ended December 31, 2019....
Listed below are account balances for Accounts Company for the fiscal year ended December 31, 2019. Long-term investments Notes payable, long-term Prepaid insurance Wages payable Common Stock Equipment Land Interest payable Interest expense Income tax payable Cost of goods sold Cash Accounts payable Buildings Accumulated depreciation Dividends General and administrative expenses Accounts receivable Inventory Notes payable, current portion Selling expenses Trademarks Sales revenue Income tax expense Supplies Retained earnings, Jan. 1, 2019 $26,250 208,500 5,250 13,500 225,000 183,750 26,250 10,500...
EXERCISE - CHAPTER 19. RATIOS: From the following Information, compute the ratios indicated and place the...
 EXERCISE - CHAPTER 19. RATIOS: From the following Information, compute the ratios indicated and place the proper number in the blanks provided. ASSETS: Cash $10,000 Marketable Securities $15,000 Accounts Receivable, Net $20,000 Inventory $30,000 Prepaid Assets $ 5,000 Property, Plant & Equipment $100,000 Total Assets: $180,000 LIABILITIES & STOCKHOLDERS' EQUITY: Current Liabilities $20,000 Long-Term Liabilities $80,000 Stockholders' Equity $80,000 Total Liabilities & Stockholder's Equity: $180,000 Sales $200,000 Cost of Goods Sold $150.000 Gross Margin $ 50,000 Operating Expense $ 30,000...
 Compute Cost of Goods Manufactured for Thor Industries for the
Fiscal Year ended 7/31/19. Hint: You don't have enough data to
solve this by analyzing the WIP account. You'll have to find
another way - by analyzing another account. Show all your
calculations.
sheet differ from or be similar to Thor Industries? Question 4: Compute Cost of Goods Manufactured for Thor Industries for the fiscal year ended 7/31/19. Hint: You don't have enough data to solve this by analyzing the...
Compute Cost of Goods Manufactured for Thor Industries for the
Fiscal Year ended 7/31/19. Hint: You don't have enough data to
solve this by analyzing the WIP account. You'll have to find
another way - by analyzing another account. Show all your
calculations.
sheet differ from or be similar to Thor Industries? Question 4: Compute Cost of Goods Manufactured for Thor Industries for the fiscal year ended 7/31/19. Hint: You don't have enough data to solve this by analyzing the...
 Compute the overall profit margin percentage for Dick's Sporting
Goods for the FY 2018 (the year ended Feb. 2, 2019). Show your
answer as a percentage, including 3 decimal points, e.g., 5/26 =
19.231 (percent).
Compute the Return on Assets for Dick's Sporting Goods for
fiscal year 2018 (the year ended Feb. 2, 2019). Show your answer as
a percentage to 3 decimal points, e.g., 5/26 = 19.231 (%).
What percentage of Dick's Sporting Good's Gross Goodwill had
been impaired...
Compute the overall profit margin percentage for Dick's Sporting
Goods for the FY 2018 (the year ended Feb. 2, 2019). Show your
answer as a percentage, including 3 decimal points, e.g., 5/26 =
19.231 (percent).
Compute the Return on Assets for Dick's Sporting Goods for
fiscal year 2018 (the year ended Feb. 2, 2019). Show your answer as
a percentage to 3 decimal points, e.g., 5/26 = 19.231 (%).
What percentage of Dick's Sporting Good's Gross Goodwill had
been impaired...
 CRUZ, INC. Income Statement For Year Ended December 31, 2017 Sales $488,000 Cost of goods sold 314,000 Gross profit 174,000 Operating expenses Depreciation expense $37,600 Other expenses 89,100 126,700 Income before taxes 47,300 Income taxes expense 17,300 Net income $ 30,000 CRUZ, INC. Comparative Balance Sheets December 31, 2017 | 2017 2016 _ Assets Cash $ 94,800 $ 24,000 Accounts receivable, net 41,000 51,000 Inventory 85,800 95,800 Prepaid expenses 5,400 4,200 Total current assets 227,000 175,000 Furniture 109,000 119,000 Accum....
 Ivanhoe Company Income Statement For the Year Ended December 31, 2022 Net sales Cost of goods sold Selling and administrative expenses Interest expense Income tax expense Net income $2,221,500 1,020,000 903,500 75,000 72,000 $ 151,000 Ivanhoe Company Balance Sheet December 31, 2022 Assets Current assets Cash Debt investments Accounts receivable (net) Inventory Total current assets Plant assets (net) Total assets Liabilities and Stockholders' Equity Current liabilities Accounts payable $ 60,300 83,000 169,900 266,500 579,700 571,500 $ 1,151,200 $ 151,000 acy...
 Sandhill Co. Income Statement For the Year Ended December 31, 2022 Net sales Cost of goods sold $2,225,500 1,010,000 900,000 81,000 Selling and administrative expenses Interest expense Income tax expense 73,500 Net income $ 161,000 Sandhill Co. Balance Sheet December 31, 2022 Assets Current assets Cash $ 56,100 Debt investments 83,000 Accounts receivable (net) 169,600 Inventory 206,300 Total current assets 515,000 Plant assets (net) 573,500 Total assets $ 1,088,500 Liabilities and Stockholders' Equity PLUUUUU Liabilities and Stockholders' Equity Current liabilities...
 Burch Industries Consolidated Income Statements (in thousands, except per share data) Year ended December 31, 2019 2017 2018 $3,405,211 Revenues $3,930,984 $3,003,610 Costs and expenses: Cost of goods sold Selling and administrative $2,386,993 $2,089,089 $1,850,530 922,261 761,498 30,665 Interest 25,739 664,061 27,316 (43) Other expenses (income) 1,475 2,141 Total costs and expenses $3,336,468 $2,883,393 $2,541,864 Income before income taxes $594,516 $521,818 $461,746 Income taxes 229,500 192,600 174,700 Net income $365,016 $329,218 $287,046 Burch Industries Consolidated Balance Sheets (in thousands) December...
 Occidental Industries Income Statement for the Year Ended December 31, 2019 200,000 106,000 Sales revenue Less: Cost of goods sold Gross profits Less: Operating expenses Selling expense General and administrative expenses Lease expense Depreciation expense Total operating expense Operating profits Less: Interest expense Net profits before taxes Less: Taxes Net profits after taxes 16,000 10,000 1,000 10,000 6,100 4,360 Occidendatal Industries Balance Sheet December 31, 2019 Assets Cash 43,500 Marketable securities 1,000 Accounts receivable 25,000 Inventories 45,500 Total current assets...
 EXERCISE - CHAPTER 19. RATIOS: From the following Information, compute the ratios indicated and place the proper number in the blanks provided. ASSETS: Cash $10,000 Marketable Securities $15,000 Accounts Receivable, Net $20,000 Inventory $30,000 Prepaid Assets $ 5,000 Property, Plant & Equipment $100,000 Total Assets: $180,000 LIABILITIES & STOCKHOLDERS' EQUITY: Current Liabilities $20,000 Long-Term Liabilities $80,000 Stockholders' Equity $80,000 Total Liabilities & Stockholder's Equity: $180,000 Sales $200,000 Cost of Goods Sold $150.000 Gross Margin $ 50,000 Operating Expense $ 30,000...
Most questions answered within 3 hours.
-
Cranium, Inc., purchases term papers from an overseas supplier
under a continuous review system. The average...
asked 3 hours ago -
1- What is the freezing point of pure water (in degrees
Celsius)?
2-
he molar mass...
asked 3 hours ago -
Determine the direction of the force that will act on the charge
in each of the...
asked 3 hours ago -
You purchase your daily coffee at the Chemist’s Coffeehouse and
have a choice of two cups:...
asked 6 hours ago -
Which of the following pairs of chemicals could be used to make
a buffer solution?
A.)...
asked 6 hours ago -
Problem 16-51 Sales
Activity Variance (LO 16-3)Odessa, Inc., reports the following
information concerning operations for the...
asked 7 hours ago -
Pictured on the right are thee point charges Q1 = 18.4 μC, Q2 =
-30.6 μC,...
asked 7 hours ago -
A graduate student is conducting research in psychology and
needs to obtain the IQ scores of...
asked 7 hours ago -
R2.84: There are 2 defective products in a production lot of 10.
An inspector randomly selected...
asked 9 hours ago -
Consider the following equilibrium system: COCl2(g) CO(g) +
Cl2(g) A 10.00 L evacuated flask is filled...
asked 9 hours ago -
1) What are the two distinct steps that one needs to perform
when developing a data...
asked 9 hours ago -
2) Write a C++ program that uses a class called “Degree” to
obtain the trigonometric
values...
asked 10 hours ago