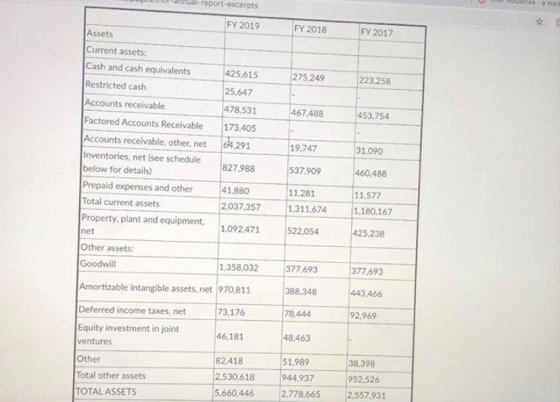
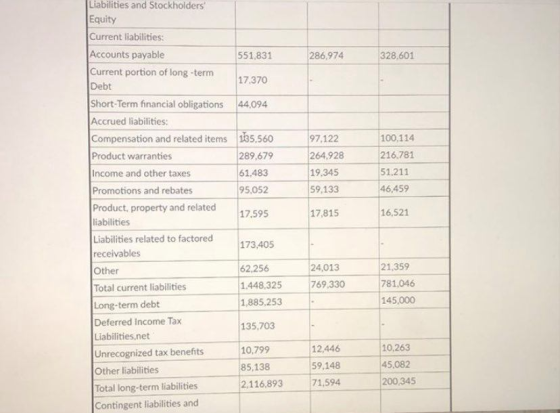
Compute Cost of Goods Manufactured for Thor Industries for the Fiscal Year ended 7/31/19. Hint: You don't have enough data to solve this by analyzing the WIP account. You'll have to find another way - by analyzing another account. Show all your calculations.


Homework Answers

Add Answer to:
Compute Cost of Goods Manufactured for Thor Industries for the
Fiscal Year ended 7/31/19. Hint: You...
Compute Cost of Goods Manufactured for Thor Industries for the Fiscal Year ended 7/31/19. Hint: You...
 Compute Cost of Goods Manufactured for Thor Industries for the
Fiscal Year ended 7/31/19. Hint: You don't have enough data to
solve this by analyzing the WIP account. You'll have to find
another way - by analyzing another account. Show all your
calculations.
Major classifications of inventories are as follows: Finished goods - RV Finished goods - other Work in process Raw materials Chassis Subtotal July 31, 2019 230,483 $ 60.593 126,636 300,721 155099 873,532 July 31, 2018 44.998 35320...
Compute Cost of Goods Manufactured for Thor Industries for the
Fiscal Year ended 7/31/19. Hint: You don't have enough data to
solve this by analyzing the WIP account. You'll have to find
another way - by analyzing another account. Show all your
calculations.
Major classifications of inventories are as follows: Finished goods - RV Finished goods - other Work in process Raw materials Chassis Subtotal July 31, 2019 230,483 $ 60.593 126,636 300,721 155099 873,532 July 31, 2018 44.998 35320...
Greenfern Corporation Income Statement for the Fiscal Year Ended July 31, 2014 Net sales $62,983 Cost...
Greenfern Corporation Income Statement for the Fiscal Year Ended July 31, 2014 Net sales $62,983 Cost of products sold 44,799 Gross profit $18,184 Selling, general, and administrative expenses 8,026 Depreciation 912 Operating income (loss) $9,246 Interest expense 558 Earnings (loss) before income taxes $8,688 Income taxes 3,041 Net earnings (loss) $5,647 Greenfern Corporation Balance Sheet as of July 31, 2014 Assets Liabilities and Stockholders’ Equity Cash and marketable securities $6,930 Accounts payable $4,848 Accounts receivable 6,746 Accrued and other liabilities...
Compute the overall profit margin percentage for Dick's Sporting Goods for the FY 2018 (the year...
 Compute the overall profit margin percentage for Dick's Sporting
Goods for the FY 2018 (the year ended Feb. 2, 2019). Show your
answer as a percentage, including 3 decimal points, e.g., 5/26 =
19.231 (percent).
Compute the Return on Assets for Dick's Sporting Goods for
fiscal year 2018 (the year ended Feb. 2, 2019). Show your answer as
a percentage to 3 decimal points, e.g., 5/26 = 19.231 (%).
What percentage of Dick's Sporting Good's Gross Goodwill had
been impaired...
Compute the overall profit margin percentage for Dick's Sporting
Goods for the FY 2018 (the year ended Feb. 2, 2019). Show your
answer as a percentage, including 3 decimal points, e.g., 5/26 =
19.231 (percent).
Compute the Return on Assets for Dick's Sporting Goods for
fiscal year 2018 (the year ended Feb. 2, 2019). Show your answer as
a percentage to 3 decimal points, e.g., 5/26 = 19.231 (%).
What percentage of Dick's Sporting Good's Gross Goodwill had
been impaired...
CRUZ, INC. Income Statement For Year Ended December 31, 2017 Sales $488,000 Cost of goods sold...
 CRUZ, INC. Income Statement For Year Ended December 31, 2017 Sales $488,000 Cost of goods sold 314,000 Gross profit 174,000 Operating expenses Depreciation expense $37,600 Other expenses 89,100 126,700 Income before taxes 47,300 Income taxes expense 17,300 Net income $ 30,000 CRUZ, INC. Comparative Balance Sheets December 31, 2017 | 2017 2016 _ Assets Cash $ 94,800 $ 24,000 Accounts receivable, net 41,000 51,000 Inventory 85,800 95,800 Prepaid expenses 5,400 4,200 Total current assets 227,000 175,000 Furniture 109,000 119,000 Accum....
Occidental Industries Income Statement for the Year Ended December 31, 2019 200,000 106,000 Sales revenue Less:...
 Occidental Industries Income Statement for the Year Ended December 31, 2019 200,000 106,000 Sales revenue Less: Cost of goods sold Gross profits Less: Operating expenses Selling expense General and administrative expenses Lease expense Depreciation expense Total operating expense Operating profits Less: Interest expense Net profits before taxes Less: Taxes Net profits after taxes 16,000 10,000 1,000 10,000 6,100 4,360 Occidendatal Industries Balance Sheet December 31, 2019 Assets Cash 43,500 Marketable securities 1,000 Accounts receivable 25,000 Inventories 45,500 Total current assets...
Consolidated Statements of Earnings For Fiscal Years Ended ($ millions) February 26, 2011 February 27, 2010...
 Consolidated Statements of Earnings For Fiscal Years Ended ($ millions) February 26, 2011 February 27, 2010 February 28, 2009 Revenue 50.272 $ 49,694 $ 45,015 Cost of goods sold 37 611 37,534 34,017 Restructuring charges - cost of goods sold Gross Profit 12,637 12,160 10,998 Selling general and administrative expenses 10.325 9,873 Restructuring charges Goodwill and tradename impairment Operating income 2,235 1,870 Other income (expense) Investment income and other 54 Investment impairment (111) Interest expense (94) Earnings before income tax...
Eagle Sporting Goods Company Income Statement Year Ended July 31, 2018 (Amounts in thousands) 174,000 Net...
 Eagle Sporting Goods Company Income Statement Year Ended July 31, 2018 (Amounts in thousands) 174,000 Net revenues Cost of goods sold 137,800 25.000 All other expenses 11,200 Net income Print Done Data Table Eagle Sporting Goods Company Balance Sheet July 31, 2018 (Amounts in thousands) Assets Current: Cash 26,200 Accounts receivable Inventories 28,600 33,000 4,600 Other current assets Total current assets Property and equipment, net Other assets 92,400 18,000 24,200 134,600 Total assets Liabilities Total current liabilities $ 60,000 1,200...
Burch Industries Consolidated Income Statements (in thousands, except per share data) Year ended December 31, 2019...
 Burch Industries Consolidated Income Statements (in thousands, except per share data) Year ended December 31, 2019 2017 2018 $3,405,211 Revenues $3,930,984 $3,003,610 Costs and expenses: Cost of goods sold Selling and administrative $2,386,993 $2,089,089 $1,850,530 922,261 761,498 30,665 Interest 25,739 664,061 27,316 (43) Other expenses (income) 1,475 2,141 Total costs and expenses $3,336,468 $2,883,393 $2,541,864 Income before income taxes $594,516 $521,818 $461,746 Income taxes 229,500 192,600 174,700 Net income $365,016 $329,218 $287,046 Burch Industries Consolidated Balance Sheets (in thousands) December...
The balance sheet and income statement for Cullumber Supply Company for the fiscal year ended June...
 The balance sheet and income statement for Cullumber Supply Company for the fiscal year ended June 30, 2017 is as follows Cullumber Supply Company Income Statement for the Fiscal Year Ended June 30, 2017($ thousands) Net sales Cost of goods sold Selling and administrative expenses Nonrecurring expenses Earnings before interest, taxes, depreciation, and amortization (EBITDA) Depreciation Earnings before interest and taxes (EBIT) Interest expense Earnings before taxes (EBT) Taxes (35%) Net income $2,133,900 1,459,400 313,000 27,600 $333,900 112,150 221,750 117,650...
Listed below are account balances for Accounts Company for the fiscal year ended December 31, 2019....
Listed below are account balances for Accounts Company for the fiscal year ended December 31, 2019. Long-term investments Notes payable, long-term Prepaid insurance Wages payable Common Stock Equipment Land Interest payable Interest expense Income tax payable Cost of goods sold Cash Accounts payable Buildings Accumulated depreciation Dividends General and administrative expenses Accounts receivable Inventory Notes payable, current portion Selling expenses Trademarks Sales revenue Income tax expense Supplies Retained earnings, Jan. 1, 2019 $26,250 208,500 5,250 13,500 225,000 183,750 26,250 10,500...
 Compute Cost of Goods Manufactured for Thor Industries for the
Fiscal Year ended 7/31/19. Hint: You don't have enough data to
solve this by analyzing the WIP account. You'll have to find
another way - by analyzing another account. Show all your
calculations.
Major classifications of inventories are as follows: Finished goods - RV Finished goods - other Work in process Raw materials Chassis Subtotal July 31, 2019 230,483 $ 60.593 126,636 300,721 155099 873,532 July 31, 2018 44.998 35320...
Compute Cost of Goods Manufactured for Thor Industries for the
Fiscal Year ended 7/31/19. Hint: You don't have enough data to
solve this by analyzing the WIP account. You'll have to find
another way - by analyzing another account. Show all your
calculations.
Major classifications of inventories are as follows: Finished goods - RV Finished goods - other Work in process Raw materials Chassis Subtotal July 31, 2019 230,483 $ 60.593 126,636 300,721 155099 873,532 July 31, 2018 44.998 35320...
 Compute the overall profit margin percentage for Dick's Sporting
Goods for the FY 2018 (the year ended Feb. 2, 2019). Show your
answer as a percentage, including 3 decimal points, e.g., 5/26 =
19.231 (percent).
Compute the Return on Assets for Dick's Sporting Goods for
fiscal year 2018 (the year ended Feb. 2, 2019). Show your answer as
a percentage to 3 decimal points, e.g., 5/26 = 19.231 (%).
What percentage of Dick's Sporting Good's Gross Goodwill had
been impaired...
Compute the overall profit margin percentage for Dick's Sporting
Goods for the FY 2018 (the year ended Feb. 2, 2019). Show your
answer as a percentage, including 3 decimal points, e.g., 5/26 =
19.231 (percent).
Compute the Return on Assets for Dick's Sporting Goods for
fiscal year 2018 (the year ended Feb. 2, 2019). Show your answer as
a percentage to 3 decimal points, e.g., 5/26 = 19.231 (%).
What percentage of Dick's Sporting Good's Gross Goodwill had
been impaired...
 CRUZ, INC. Income Statement For Year Ended December 31, 2017 Sales $488,000 Cost of goods sold 314,000 Gross profit 174,000 Operating expenses Depreciation expense $37,600 Other expenses 89,100 126,700 Income before taxes 47,300 Income taxes expense 17,300 Net income $ 30,000 CRUZ, INC. Comparative Balance Sheets December 31, 2017 | 2017 2016 _ Assets Cash $ 94,800 $ 24,000 Accounts receivable, net 41,000 51,000 Inventory 85,800 95,800 Prepaid expenses 5,400 4,200 Total current assets 227,000 175,000 Furniture 109,000 119,000 Accum....
 Occidental Industries Income Statement for the Year Ended December 31, 2019 200,000 106,000 Sales revenue Less: Cost of goods sold Gross profits Less: Operating expenses Selling expense General and administrative expenses Lease expense Depreciation expense Total operating expense Operating profits Less: Interest expense Net profits before taxes Less: Taxes Net profits after taxes 16,000 10,000 1,000 10,000 6,100 4,360 Occidendatal Industries Balance Sheet December 31, 2019 Assets Cash 43,500 Marketable securities 1,000 Accounts receivable 25,000 Inventories 45,500 Total current assets...
 Consolidated Statements of Earnings For Fiscal Years Ended ($ millions) February 26, 2011 February 27, 2010 February 28, 2009 Revenue 50.272 $ 49,694 $ 45,015 Cost of goods sold 37 611 37,534 34,017 Restructuring charges - cost of goods sold Gross Profit 12,637 12,160 10,998 Selling general and administrative expenses 10.325 9,873 Restructuring charges Goodwill and tradename impairment Operating income 2,235 1,870 Other income (expense) Investment income and other 54 Investment impairment (111) Interest expense (94) Earnings before income tax...
 Eagle Sporting Goods Company Income Statement Year Ended July 31, 2018 (Amounts in thousands) 174,000 Net revenues Cost of goods sold 137,800 25.000 All other expenses 11,200 Net income Print Done Data Table Eagle Sporting Goods Company Balance Sheet July 31, 2018 (Amounts in thousands) Assets Current: Cash 26,200 Accounts receivable Inventories 28,600 33,000 4,600 Other current assets Total current assets Property and equipment, net Other assets 92,400 18,000 24,200 134,600 Total assets Liabilities Total current liabilities $ 60,000 1,200...
 Burch Industries Consolidated Income Statements (in thousands, except per share data) Year ended December 31, 2019 2017 2018 $3,405,211 Revenues $3,930,984 $3,003,610 Costs and expenses: Cost of goods sold Selling and administrative $2,386,993 $2,089,089 $1,850,530 922,261 761,498 30,665 Interest 25,739 664,061 27,316 (43) Other expenses (income) 1,475 2,141 Total costs and expenses $3,336,468 $2,883,393 $2,541,864 Income before income taxes $594,516 $521,818 $461,746 Income taxes 229,500 192,600 174,700 Net income $365,016 $329,218 $287,046 Burch Industries Consolidated Balance Sheets (in thousands) December...
 The balance sheet and income statement for Cullumber Supply Company for the fiscal year ended June 30, 2017 is as follows Cullumber Supply Company Income Statement for the Fiscal Year Ended June 30, 2017($ thousands) Net sales Cost of goods sold Selling and administrative expenses Nonrecurring expenses Earnings before interest, taxes, depreciation, and amortization (EBITDA) Depreciation Earnings before interest and taxes (EBIT) Interest expense Earnings before taxes (EBT) Taxes (35%) Net income $2,133,900 1,459,400 313,000 27,600 $333,900 112,150 221,750 117,650...
Most questions answered within 3 hours.
-
For the reaction CaI2+2AgNO3⟶2AgI+Ca(NO3)2 how many grams of
silver iodide, AgI, are produced from 56.5 g...
asked 37 seconds from now -
Write an equation for hydrolysis via acid catalysis.
Using ethyl acetate, ethyl benzoate, ethyl formate or...
asked 7 minutes ago -
Only one graph is needed.
(a) Draw a Supply Curve and the Demand Curve for the...
asked 10 minutes ago -
Fill in the blanks and please show how you arrived at numerical
answers
. The...
asked 10 minutes ago -
91. If the half – life of a sample of radioactive
material is 60 days, what...
asked 17 minutes ago -
White light (380nm-750nm) strikes a diffraction grating (420
lines/mm) at normal incidence. What is the highest-order...
asked 26 minutes ago -
1) Explain what is meant by a good being "excludable."?
2) Explain what is meant by...
asked 26 minutes ago -
I need help with this question:
Describe in detail at least two factors that stimulated American...
asked 33 minutes ago -
Calculate the Boyle temperature for helium assuming it follows
the Berthelot equation of state.
asked 33 minutes ago -
Summarize Strategic Corporate Social Responsibility, 4th edition
2017 book, chapter one and two.
asked 34 minutes ago -
1. If the standard deviations for return on stock A and stock B
are 28% and...
asked 49 minutes ago -
Please use python to explain.
Assume that the variables x and
y refer to strings. Write...
asked 56 minutes ago