The comparative statements of Enchanted Ltd are presented here.
|
ENCHANTED LTD |
||
|
Statement of profit or loss |
||
|
for the years ended 30 June |
||
|
2019 |
2020 |
|
|
Net sales |
$1340000 |
$1180000 |
|
Cost of sales |
656600 |
542800 |
|
Gross profit |
683400 |
637200 |
|
Selling and administrative expense |
300696 |
439668 |
|
Finance costs |
27336 |
57348 |
|
Profit before income tax |
355368 |
140184 |
|
Income tax expense |
95949 |
35046 |
|
Profit for the period |
$259419 |
$105138 |
|
ENCHANTED LTD |
||
|
Statement of financial position |
||
|
as at 30 June |
||
|
Assets |
2019 |
2020 |
|
Current assets |
||
|
Cash |
77000 |
70000 |
|
Accounts receivable (net) |
219000 |
270000 |
|
Inventory |
47000 |
40420 |
|
Total current assets |
343000 |
380420 |
|
Non-current assets |
||
|
Property, plant and equipment (net) |
562400 |
706800 |
|
Total assets |
$905400 |
$1087220 |
|
Liabilities and equity |
||
|
Current liabilities |
||
|
Accounts payable |
$288000 |
$261000 |
|
Income taxes payable |
51812 |
19275 |
|
Total current liabilities |
339812 |
280275 |
|
Non-current liabilities |
||
|
Loan payable |
437100 |
394800 |
|
Total liabilities |
776912 |
675075 |
|
Equity |
||
|
Share capital |
89942 |
284380 |
|
Retained earnings |
38546 |
127765 |
|
Total equity |
128488 |
412145 |
|
Total liabilities and equity |
$905400 |
$1087220 |
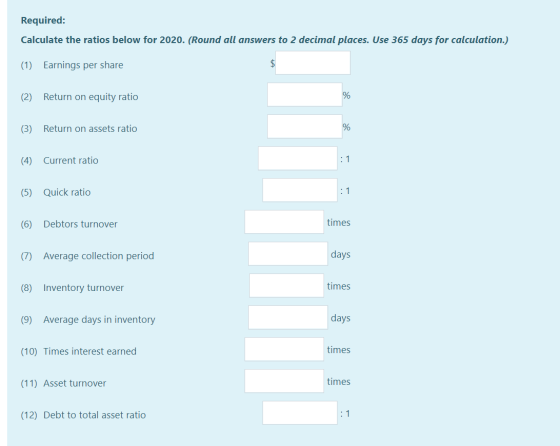
All sales were on account.. The weighted
average number of shares is 17988.
Homework Answers
Enchanted Ltd
| Sl no | Formula | ||
| a | Earnings per share | net profit/weighted average equity shares |
105,138/17,988 = $ 5.84 |
| b | Return on equity | net profit/average equity |
105,138/(128,488+412,145)/2 = 105,138/270,316.5 = 38.89% |
| c | Return on assets | net profit/average assets |
105,138/(1087,220+905,400)/2 = 105,138/996,310 = 10.55% |
| d | Current ratio | current assets/current liabilities |
380,420/280,275 = 1.36 : 1 |
| e | Quick ratio | quick assets/current liabilities |
(70,000+270,000)/280,275 = 1.21 : 1 |
| f | Debtors inventory | net sales/average debtors |
1180,000/(270,000+219,000)/2 = 1180,000/244,500 = 4.83 times |
| g | Average collection period | 365/debtors turnover |
365/4.83 = 75.57 days |
| h | Inventory turnover | cost of goods sold/average inventory |
542,800/(40,420+47,000)/2 = 542,800/43,710 = 12.42 times |
| i | Average days in inventory | 365/ inventory turnover |
365/12.42 = 29.39 days |
| j | Times interest earned | operating income/interest |
(140,184+57,348)/57,348 = 197,532/57,348 = 3.44 times |
| k | Assets turnover | net sales/average assets |
1180,000/996,310 = 1.18 times |
| l | Debt to total assets | total liabilities/total assets |
675,075/1087,220 = 0.62 : 1 |
Add Answer to:
The comparative statements of Enchanted Ltd are
presented here.
ENCHANTED LTD
Statement of profit or loss...
The comparative statements of Flint Interiors Ltd. are presented as follows: FLINT INTERIORS LTD. Income Statement...
 The comparative statements of Flint Interiors Ltd. are presented as follows: FLINT INTERIORS LTD. Income Statement For the Year Ended December 31, 2021 Net sales $2,087,750 Cost of goods sold 1,155,000 Gross profit 932,750 Selling and administrative expenses 520,000 Income from operations 412,750 Other expenses and losses Interest expense 15,500 Income before income taxes 397,250 Income tax expense 104,275 Profit $292,975 2020 $1,810,500 1,012,500 798,000 484,000 314,000 12,000 302,000 84,000 $218,000 FLINT INTERIORS LTD. Balance Sheet December 31 2021 2020...
Question 9 The comparative statements of Wahlberg Company are presented here. Wahlberg Company Income Statement For...
 Question 9 The comparative statements of Wahlberg Company are presented here. Wahlberg Company Income Statement For the Years Ended December 31 2020 Net sales $1,813,600 Cost of goods sold 1,013,400 Gross profit 800,200 Selling and administrative expenses 514,800 Income from operations 285,400 Other expenses and losses Interest expense 17,400 Income before income taxes 268,000 Income tax expense 78,019 Net income $ 189,981 2019 $1,746,200 990,000 756,200 474,000 282,200 14,400 267,800 77,600 $ 190,200 Wahlberg Company Balance Sheets December 31 2020...
CALCULATOR The comparative statements of Wahlberg Company are presented here. 2019 Wahlberg Company Income Statement For...
 CALCULATOR The comparative statements of Wahlberg Company are presented here. 2019 Wahlberg Company Income Statement For the Years Ended December 31 2020 Net sales $1,813,600 Cost of goods sold 1,013,400 Gross profit 800,200 Selling and administrative expenses 514,800 Income from operations 285,400 Other expenses and losses Interest expense 17,400 Income before income taxes 268,000 Income tax expense 78,019 Net income $ 189,981 $1,746,200 990,000 756,200 474,000 282,200 14,400 267,800 77,600 $ 190,200 Wahlberg Company Balance Sheets December 31 2020 2019...
The comparative statements of Wahlberg Company are presented here. Wahlberg Company Income Statement For the Years...
The comparative statements of Wahlberg Company are presented here. Wahlberg Company Income Statement For the Years Ended December 31 2020 2019 Net sales $1,815,100 $1,745,300 Cost of goods sold 1,011,300 995,000 Gross profit 803,800 750,300 Selling and administrative expenses 517,400 479,000 Income from operations 286,400 271,300 Other expenses and losses Interest expense 18,800 13,500 Income before income taxes 267,600 257,800 Income tax expense 80,016 77,100 Net income $ 187,584 $ 180,700 Wahlberg Company Balance Sheets December 31 Assets 2020 2019...
The comparative statements of Wahlberg Company are presented here. Wahlberg Company Income Statement For the Years...
The comparative statements of Wahlberg Company are presented here. Wahlberg Company Income Statement For the Years Ended December 31 2020 2019 Net sales $1,810,000 $1,745,000 Cost of goods sold 1,005,000 970,000 Gross profit 805,000 775,000 Selling and administrative expenses 511,000 472,000 Income from operations 294,000 303,000 Other expenses and losses Interest expense 17,000 13,000 Income before income taxes 277,000 290,000 Income tax expense 77,500 76,000 Net income $ 199,500 $ 214,000 Wahlberg Company Balance Sheets December 31 Assets 2020 2019...
The comparative statements of Wahlberg Company are presented here. Wahlberg Company Income Statement For the Years...
 The comparative statements of Wahlberg Company are presented here. Wahlberg Company Income Statement For the Years Ended December 31 2020 2019 $1,815,700 1,011,000 804,700 515,000 289,700 $1,749,500 981,000 768,500 477,600 290,900 Net sales Cost of goods sold Gross profit Selling and administrative expenses Income from operations Other expenses and losses Interest expense Income before income taxes Income tax expense Net income 19,000 270,700 80,521 $ 190,179 14,300 276,600 76,700 $ 199,900 2019 Wahlberg Company Balance Sheets December 31 Assets 2020...
Thank you The comparative statements of Wahlberg Company are presented here. Wahlberg Company Income Statement For...
 Thank you
The comparative statements of Wahlberg Company are presented here. Wahlberg Company Income Statement For the Years Ended December 31 2020 2019 Net sales Cost of goods sold Gross profit Selling and administrative expenses Income from operations Other expenses and losses Interest expense Income before income taxes Income tax expense $1,813,600 1,007,100 806,500 519,800 286,700 $1,750,700 978,000 772,700 472,000 300,700 17,100 269,600 80,015 $ 189,585 14,200 286,500 77,500 $ 209,000 Net income 2019 $64,600 50,300 102,800 115,600 333,300 523,900...
Thank you
The comparative statements of Wahlberg Company are presented here. Wahlberg Company Income Statement For the Years Ended December 31 2020 2019 Net sales Cost of goods sold Gross profit Selling and administrative expenses Income from operations Other expenses and losses Interest expense Income before income taxes Income tax expense $1,813,600 1,007,100 806,500 519,800 286,700 $1,750,700 978,000 772,700 472,000 300,700 17,100 269,600 80,015 $ 189,585 14,200 286,500 77,500 $ 209,000 Net income 2019 $64,600 50,300 102,800 115,600 333,300 523,900...
The comparative statements of Wahlberg Company are presented here. Wahlberg Company Income Statement For the Years...
 The comparative statements of Wahlberg Company are presented here. Wahlberg Company Income Statement For the Years Ended December 31 2020 2019 Net sales $1,811,500 $1,752,200 Cost of goods sold 1,008,900 982,000 Gross profit 802.600 770,200 518,600 472,800 284.000 297,400 Selling and administrative expenses Income from operations Other expenses and losses Interest expense Income before income taxes Income tax expense Net income 17,800 13.800 266,200 283,600 80,152 $ 186,048 76,400 $207,200 Netin Wahlberg Company Balance Sheets December 31 Assets 2020 2019...
Problem 18-02A (Video) The comparative statements of Wahlberg Company are presented here. Wahlberg Company Income Statement...
Problem 18-02A (Video) The comparative statements of Wahlberg Company are presented here. Wahlberg Company Income Statement For the Years Ended December 31 2020 2019 Net sales $1,810,000 $1,745,000 Cost of goods sold 1,005,000 970,000 Gross profit 805,000 775,000 Selling and administrative expenses 511,000 472,000 Income from operations 294,000 303,000 Other expenses and losses Interest expense 17,000 13,000 Income before income taxes 277,000 290,000 Income tax expense 77,500 76,000 Net income $ 199,500 $ 214,000 Wahlberg Company Balance Sheets December 31...
Problem 18-02A (Video) The comparative statements of Wahlberg Company are presented here. Wahlberg Company Income Statement...
 Problem 18-02A (Video) The comparative statements of Wahlberg Company are presented here. Wahlberg Company Income Statement For the Years Ended December 31 2020 Net sales $1,817,200 Cost of goods sold 1,012,800 Gross profit 804,400 Selling and administrative expenses 516,400 Income from operations 288,000 Other expenses and losses Interest expense 17,700 Income before income taxes 270,300 Income tax expense 80,022 Net income $ 190,278 2019 $1,749,800 970,000 779,800 475,600 304,200 15,000 289,200 77,900 $ 211,300 Wahlberg Company Balance Sheets December 31...
 The comparative statements of Flint Interiors Ltd. are presented as follows: FLINT INTERIORS LTD. Income Statement For the Year Ended December 31, 2021 Net sales $2,087,750 Cost of goods sold 1,155,000 Gross profit 932,750 Selling and administrative expenses 520,000 Income from operations 412,750 Other expenses and losses Interest expense 15,500 Income before income taxes 397,250 Income tax expense 104,275 Profit $292,975 2020 $1,810,500 1,012,500 798,000 484,000 314,000 12,000 302,000 84,000 $218,000 FLINT INTERIORS LTD. Balance Sheet December 31 2021 2020...
 Question 9 The comparative statements of Wahlberg Company are presented here. Wahlberg Company Income Statement For the Years Ended December 31 2020 Net sales $1,813,600 Cost of goods sold 1,013,400 Gross profit 800,200 Selling and administrative expenses 514,800 Income from operations 285,400 Other expenses and losses Interest expense 17,400 Income before income taxes 268,000 Income tax expense 78,019 Net income $ 189,981 2019 $1,746,200 990,000 756,200 474,000 282,200 14,400 267,800 77,600 $ 190,200 Wahlberg Company Balance Sheets December 31 2020...
 CALCULATOR The comparative statements of Wahlberg Company are presented here. 2019 Wahlberg Company Income Statement For the Years Ended December 31 2020 Net sales $1,813,600 Cost of goods sold 1,013,400 Gross profit 800,200 Selling and administrative expenses 514,800 Income from operations 285,400 Other expenses and losses Interest expense 17,400 Income before income taxes 268,000 Income tax expense 78,019 Net income $ 189,981 $1,746,200 990,000 756,200 474,000 282,200 14,400 267,800 77,600 $ 190,200 Wahlberg Company Balance Sheets December 31 2020 2019...
 The comparative statements of Wahlberg Company are presented here. Wahlberg Company Income Statement For the Years Ended December 31 2020 2019 $1,815,700 1,011,000 804,700 515,000 289,700 $1,749,500 981,000 768,500 477,600 290,900 Net sales Cost of goods sold Gross profit Selling and administrative expenses Income from operations Other expenses and losses Interest expense Income before income taxes Income tax expense Net income 19,000 270,700 80,521 $ 190,179 14,300 276,600 76,700 $ 199,900 2019 Wahlberg Company Balance Sheets December 31 Assets 2020...
 Thank you
The comparative statements of Wahlberg Company are presented here. Wahlberg Company Income Statement For the Years Ended December 31 2020 2019 Net sales Cost of goods sold Gross profit Selling and administrative expenses Income from operations Other expenses and losses Interest expense Income before income taxes Income tax expense $1,813,600 1,007,100 806,500 519,800 286,700 $1,750,700 978,000 772,700 472,000 300,700 17,100 269,600 80,015 $ 189,585 14,200 286,500 77,500 $ 209,000 Net income 2019 $64,600 50,300 102,800 115,600 333,300 523,900...
Thank you
The comparative statements of Wahlberg Company are presented here. Wahlberg Company Income Statement For the Years Ended December 31 2020 2019 Net sales Cost of goods sold Gross profit Selling and administrative expenses Income from operations Other expenses and losses Interest expense Income before income taxes Income tax expense $1,813,600 1,007,100 806,500 519,800 286,700 $1,750,700 978,000 772,700 472,000 300,700 17,100 269,600 80,015 $ 189,585 14,200 286,500 77,500 $ 209,000 Net income 2019 $64,600 50,300 102,800 115,600 333,300 523,900...
 The comparative statements of Wahlberg Company are presented here. Wahlberg Company Income Statement For the Years Ended December 31 2020 2019 Net sales $1,811,500 $1,752,200 Cost of goods sold 1,008,900 982,000 Gross profit 802.600 770,200 518,600 472,800 284.000 297,400 Selling and administrative expenses Income from operations Other expenses and losses Interest expense Income before income taxes Income tax expense Net income 17,800 13.800 266,200 283,600 80,152 $ 186,048 76,400 $207,200 Netin Wahlberg Company Balance Sheets December 31 Assets 2020 2019...
 Problem 18-02A (Video) The comparative statements of Wahlberg Company are presented here. Wahlberg Company Income Statement For the Years Ended December 31 2020 Net sales $1,817,200 Cost of goods sold 1,012,800 Gross profit 804,400 Selling and administrative expenses 516,400 Income from operations 288,000 Other expenses and losses Interest expense 17,700 Income before income taxes 270,300 Income tax expense 80,022 Net income $ 190,278 2019 $1,749,800 970,000 779,800 475,600 304,200 15,000 289,200 77,900 $ 211,300 Wahlberg Company Balance Sheets December 31...
Most questions answered within 3 hours.
-
A 10.000 g sample of water contains 11.19% H by mass. what
should be the %H...
asked 40 seconds ago -
Consider an investment game among 2 players. Each player can
either invest,
i, or not invest,-i....
asked 1 minute from now -
The time taken to complete a particular task is normally
distributed with a standard deviation of...
asked 8 minutes ago -
we have heteroskedasticity in a regression when:
When the variance of error terms changes when an...
asked 17 minutes ago -
Explain some different types of fungi. State the different
divisions undergo by fungi.
asked 30 minutes ago -
The shortest time that 120 C can flow through a 20 A circuit
breaker without tripping...
asked 31 minutes ago -
A software design pattern is a general, reusable solution to a
commonly occurring problem, acting as...
asked 33 minutes ago -
The mean waiting time at the drive-through of a fast-food
restaurant from the time an order...
asked 50 minutes ago -
The pitch (p) of a helix is defined as p = dn, in which n is...
asked 52 minutes ago -
Do you agree that the declining stock of social capital is the
blame for the failure...
asked 55 minutes ago -
A researcher is interested in whether coffee consumption helps
with performance on reading comprehension tasks. The...
asked 1 hour ago -
it has been estimated since the beginning of the human race that
about 133 metric ton...
asked 1 hour ago