
Homework Answers
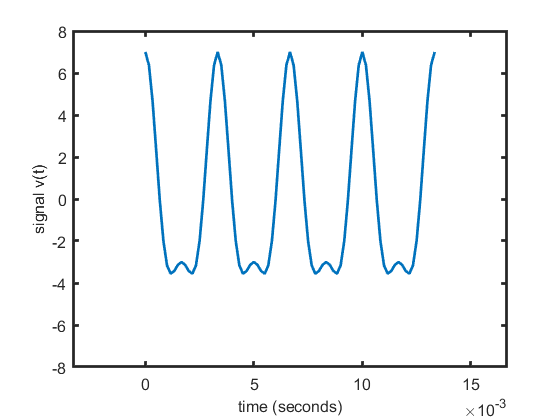
The first term of the function has period 1/300s
The second term of the function has period 1/600s
So the time period of the function v(t) is LCM(1/300,1/600) = 1/300 s = Tperiod
4 periods = 4/300 s = Tmax
step = 1/20 * 1/300 s (To get 20 samples per period)
xmin = -Tperiod (Since the function starts at 0)
xmax = Tmax + Tperiod (Since the function ends at Tmax)
min(v(t)) = -5-2 = -7
max(v(t) = 5+2 = 7
ymin = min(v(t)) - 1 = -8
ymax = max(v(t)) + 1 = 8
-------------------------------------------Code------------------------------------------------
Tmax = 4/300;
step = 1/20 * 1/300;
xmin = -1/300;
xmax = Tmax + 1/300;
ymin = -8;
ymax = 8;
t = 0:step:Tmax;
v = 5*cos(2*pi*300*t) + 2*sin(2*pi*600*t + pi/2);
plot(t,v)
xlabel('time (seconds)')
ylabel('signal v(t)')
axis([xmin,xmax,ymin,ymax])

Add Answer to:
(15 points) This problem is related to Problem 3.7 in the text. consider reviewing Section 3.2.1.1....
% PA 08: 3D Plots, Files, Functions % Using the script provided and the functions provided,...
 % PA 08: 3D Plots, Files, Functions
% Using the script provided and the functions provided,
complete the code
% to be able to plot specified graphs. Script file contains a
menu of
% choices where user will select which plot to produce.
% Functions contain the necessary code to plot. Please note
that functions
% do NOT take any arguments and do NOT return anything.
% You are provided with two MS Excel files that you must use
to...
% PA 08: 3D Plots, Files, Functions
% Using the script provided and the functions provided,
complete the code
% to be able to plot specified graphs. Script file contains a
menu of
% choices where user will select which plot to produce.
% Functions contain the necessary code to plot. Please note
that functions
% do NOT take any arguments and do NOT return anything.
% You are provided with two MS Excel files that you must use
to...
CODE GIVEN % Create a program to plot the motion of the ping pong ball with...
 CODE GIVEN
% Create a program to plot the motion of the ping pong ball with
drag.
% The program will take inputs for velocity in m/s and angle of
launch.
% note that with a high speed camera I estmated a launch speed
for a ping
% pong ball could be 30 m/s.
vel=30; %m/s
angle=60;
% convert the degrees into radians so MATLAB likes it
angle=angle*pi/180;
% set initial values (time, distance, mass, gravity, drag)
x(1)=0; % meters...
CODE GIVEN
% Create a program to plot the motion of the ping pong ball with
drag.
% The program will take inputs for velocity in m/s and angle of
launch.
% note that with a high speed camera I estmated a launch speed
for a ping
% pong ball could be 30 m/s.
vel=30; %m/s
angle=60;
% convert the degrees into radians so MATLAB likes it
angle=angle*pi/180;
% set initial values (time, distance, mass, gravity, drag)
x(1)=0; % meters...
 % PA 08: 3D Plots, Files, Functions
% Using the script provided and the functions provided,
complete the code
% to be able to plot specified graphs. Script file contains a
menu of
% choices where user will select which plot to produce.
% Functions contain the necessary code to plot. Please note
that functions
% do NOT take any arguments and do NOT return anything.
% You are provided with two MS Excel files that you must use
to...
% PA 08: 3D Plots, Files, Functions
% Using the script provided and the functions provided,
complete the code
% to be able to plot specified graphs. Script file contains a
menu of
% choices where user will select which plot to produce.
% Functions contain the necessary code to plot. Please note
that functions
% do NOT take any arguments and do NOT return anything.
% You are provided with two MS Excel files that you must use
to...
 CODE GIVEN
% Create a program to plot the motion of the ping pong ball with
drag.
% The program will take inputs for velocity in m/s and angle of
launch.
% note that with a high speed camera I estmated a launch speed
for a ping
% pong ball could be 30 m/s.
vel=30; %m/s
angle=60;
% convert the degrees into radians so MATLAB likes it
angle=angle*pi/180;
% set initial values (time, distance, mass, gravity, drag)
x(1)=0; % meters...
CODE GIVEN
% Create a program to plot the motion of the ping pong ball with
drag.
% The program will take inputs for velocity in m/s and angle of
launch.
% note that with a high speed camera I estmated a launch speed
for a ping
% pong ball could be 30 m/s.
vel=30; %m/s
angle=60;
% convert the degrees into radians so MATLAB likes it
angle=angle*pi/180;
% set initial values (time, distance, mass, gravity, drag)
x(1)=0; % meters...
Most questions answered within 3 hours.
-
Under the influence of its drive force, a snowmobile is moving
at a constant velocity along...
asked 9 minutes ago -
What mechanisms Drive speciation??
(I.e. what was Dawins theory on the orgin of species, and how...
asked 1 hour ago -
The manager at a car assembly plant believes that the mean
assembly time for a car...
asked 2 hours ago -
Which of the following is true of electron capture?
A) It decreases the nuclide's mass number...
asked 3 hours ago -
Assuming an efficiency of 43.10%, calculate the actual yield of
magnesium nitrate formed from 114.9 g...
asked 4 hours ago -
The highly pathogenic bacterium Clostridium
perfringens causes gangrene, a disease that results in the
destruction of...
asked 6 hours ago -
In the context of situation analysis, which of the following is
a category for analysis in...
asked 6 hours ago -
In a study of the gas phase decomposition of sulfuryl chloride
at 600 K SO2Cl2(g)SO2(g) +...
asked 6 hours ago -
75 g of 2-propanol (C3H8O) and 25 g of pentane are mixed in a
200 mL...
asked 6 hours ago -
The 2800-turn coil in a dc motor has an area per turn of 1.1 ×
10-2...
asked 6 hours ago -
Draw a combinational logic circuit diagram with a symbol inside
the box for two I/P of...
asked 6 hours ago -
The cliché we use quite a lot in finance is: there is a need to
maximize...
asked 6 hours ago