Options are ( pareto diagram, bar chart, pie chart, histogram, polygon, oglive)
Homework Answers
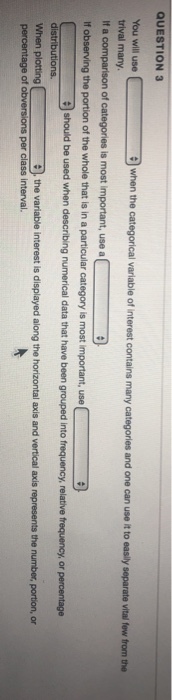
- You will use pareto diagram when the categorical variable of interest contains many categories and one can use it to easily separate vital few from the trivial many.
- If a comparison of caegories is most important , use a bar chart
- If observing the portion of the whole that is in a particular category is most important, use Pie chart.
- Histogram should be used when describing numerical data that have been grouped into frequency, relative frequencyor percentage distributions.
- When plotting , polygon or ogive the variable interest is displayed along the horizontal axis and vertical axis represents number, portion , or percentage of observations per class interval.
Add Answer to:
Options are ( pareto diagram, bar chart, pie chart, histogram,
polygon, oglive)
Explain the differences between graphical presentations: a pie chart, bar chart, histogram, and line chart.
Explain the differences between graphical presentations: a pie chart, bar chart, histogram, and line chart.
6. 1.07/2.14 points | Previous Answers BBUnderStat12 2.R.001 Consider these types of graphs: histogram, bar graph,...
 6. 1.07/2.14 points | Previous Answers BBUnderStat12 2.R.001 Consider these types of graphs: histogram, bar graph, Pareto chart, pie chart, stem-and-leaf display. (a) Which are suitable for qualitative data? (Select all that apply.) bar graph pie chart Pareto chart histogram Ostem-and-leaf display
What is the difference between a histogram and bar chart? (Explain in at least 4 sentences)...
What is the difference between a histogram and bar chart? (Explain in at least 4 sentences) What is the difference between a pie chart (circle) and a bar graph? When should you use a pie chart instead of a bar chart? (Answer in at least 5 sentences)
Which of the following graphic devices is NOT appropriate for interval-ratio level data? Histogram Frequency polygon...
Which of the following graphic devices is NOT appropriate for interval-ratio level data? Histogram Frequency polygon Time series chart Pie chart
Which option is correct? a. GRAPH b. histogram c. pareto diagram d. scater diagram e. cause...
 Which option is correct?
a. GRAPH
b. histogram
c. pareto diagram
d. scater diagram
e. cause and effect
f. control chart
g. check sheet
h. Radar chart
.
The QA manager wouild like to determine the Dest supplier of PVC compound used for the manufacturing of plastic tubes
Which option is correct?
a. GRAPH
b. histogram
c. pareto diagram
d. scater diagram
e. cause and effect
f. control chart
g. check sheet
h. Radar chart
.
The QA manager wouild like to determine the Dest supplier of PVC compound used for the manufacturing of plastic tubes
Which option is correct? a. GRAPH b. histogram c. pareto diagram d. scater diagram e. cause...
 Which option is correct?
a. GRAPH
b. histogram
c. pareto diagram
d. scater diagram
e. cause and effect
f. control chart
g. check sheet
.
The supervisor would like to monitor the frequency of defects occurring in the packing process.
Which option is correct?
a. GRAPH
b. histogram
c. pareto diagram
d. scater diagram
e. cause and effect
f. control chart
g. check sheet
.
The supervisor would like to monitor the frequency of defects occurring in the packing process.
Which option is correct? a. GRAPH b. histogram c. pareto diagram d. scater diagram e. cause...
 Which option is correct?
a. GRAPH
b. histogram
c. pareto diagram
d. scater diagram
e. cause and effect
f. control chart
g. check sheet
The manager wants to know if the bottling process is stable in terms of bottle contents.
Which option is correct?
a. GRAPH
b. histogram
c. pareto diagram
d. scater diagram
e. cause and effect
f. control chart
g. check sheet
The manager wants to know if the bottling process is stable in terms of bottle contents.
Which option is correct? a. GRAPH b. histogram c. pareto diagram d. scater diagram e. cause...
 Which option is correct?
a. GRAPH
b. histogram
c. pareto diagram
d. scater diagram
e. cause and effect
f. control chart
g. check sheet
h. Radar chart
The General Manager wants to receive a QC report that reflects the exact quantity of finished goods that are rejected from the line on a daily basis.
Which option is correct?
a. GRAPH
b. histogram
c. pareto diagram
d. scater diagram
e. cause and effect
f. control chart
g. check sheet
h. Radar chart
The General Manager wants to receive a QC report that reflects the exact quantity of finished goods that are rejected from the line on a daily basis.
. Determine which of the following is the best method (histogram, bar chart, box plot, stem...
. Determine which of the following is the best method (histogram, bar chart, box plot, stem and leaf diagram, or pie chart) of displaying the results of the following studies (some may have multiple answers) a) You concluded a study determining the favorite meal choice (from a list of 5 options) from a sample of 100 people. You want the data displayed so that an individual could easily determine the most frequently favored of these options. b) You concluded a...
How to choose proper graphs (pie chart, bar chart, and histograms)?
How to choose proper graphs (pie chart, bar chart, and histograms)?
 6. 1.07/2.14 points | Previous Answers BBUnderStat12 2.R.001 Consider these types of graphs: histogram, bar graph, Pareto chart, pie chart, stem-and-leaf display. (a) Which are suitable for qualitative data? (Select all that apply.) bar graph pie chart Pareto chart histogram Ostem-and-leaf display
 Which option is correct?
a. GRAPH
b. histogram
c. pareto diagram
d. scater diagram
e. cause and effect
f. control chart
g. check sheet
h. Radar chart
.
The QA manager wouild like to determine the Dest supplier of PVC compound used for the manufacturing of plastic tubes
Which option is correct?
a. GRAPH
b. histogram
c. pareto diagram
d. scater diagram
e. cause and effect
f. control chart
g. check sheet
h. Radar chart
.
The QA manager wouild like to determine the Dest supplier of PVC compound used for the manufacturing of plastic tubes
 Which option is correct?
a. GRAPH
b. histogram
c. pareto diagram
d. scater diagram
e. cause and effect
f. control chart
g. check sheet
.
The supervisor would like to monitor the frequency of defects occurring in the packing process.
Which option is correct?
a. GRAPH
b. histogram
c. pareto diagram
d. scater diagram
e. cause and effect
f. control chart
g. check sheet
.
The supervisor would like to monitor the frequency of defects occurring in the packing process.
 Which option is correct?
a. GRAPH
b. histogram
c. pareto diagram
d. scater diagram
e. cause and effect
f. control chart
g. check sheet
The manager wants to know if the bottling process is stable in terms of bottle contents.
Which option is correct?
a. GRAPH
b. histogram
c. pareto diagram
d. scater diagram
e. cause and effect
f. control chart
g. check sheet
The manager wants to know if the bottling process is stable in terms of bottle contents.
 Which option is correct?
a. GRAPH
b. histogram
c. pareto diagram
d. scater diagram
e. cause and effect
f. control chart
g. check sheet
h. Radar chart
The General Manager wants to receive a QC report that reflects the exact quantity of finished goods that are rejected from the line on a daily basis.
Which option is correct?
a. GRAPH
b. histogram
c. pareto diagram
d. scater diagram
e. cause and effect
f. control chart
g. check sheet
h. Radar chart
The General Manager wants to receive a QC report that reflects the exact quantity of finished goods that are rejected from the line on a daily basis.
Most questions answered within 3 hours.
-
Investor company owns 35% of investee company voting stock and
accounts for the investment under the...
asked 40 seconds ago -
The number of major faults on a randomly chosen 1 km stretch of
highway has a...
asked 25 minutes ago -
Consider the competitive environment of Starbuck's, Progressive
Insurance, a manufacturing firm with low turnover, or a...
asked 1 hour ago -
3. Gains from trade
Consider two neighbouring island countries called Euphoria and
Contente. They each have...
asked 3 hours ago -
A business executive has the option to invest money in two
plans: Plan A guarantees that...
asked 5 hours ago -
Hello, can someone please help me answer this question?
How much heat is absorbed by a...
asked 5 hours ago -
. A marketing researcher conducted a survey of 25 shoppers
randomly selected at the local mall...
asked 5 hours ago -
Create an comprehensive response to the
following:
Antimicrobial agents work on a multitude of microbes (bacteria,...
asked 5 hours ago -
6.13 LAB: Step counter. Section 6.3.
A pedometer treats walking 2,000 steps as walking 1 mile....
asked 5 hours ago -
(14.2) A block of mass m = 10 kg riding on a frictionless
horizontal plane is...
asked 5 hours ago -
Use any search engine to search for articles about Starbucks
partnership with Tata Companies in India...
asked 5 hours ago -
Let’s say that for some reason Bank Excess Reserves suddenly
increase sharply. What effect would this...
asked 5 hours ago