
I am trying to figure out part a, maybe then I can do b.
Thanks
Homework Answers
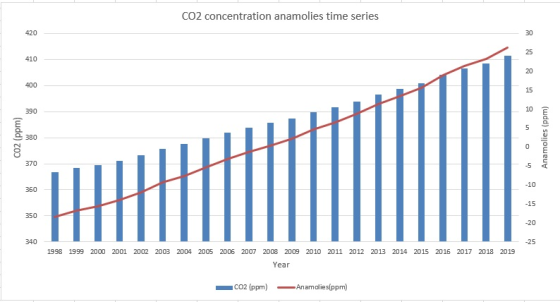
a. To address the a part I have constructed a table to calculate the anamolies.
First I have calculated the mean of 20 years (1998-2017), which is 385.15 (rounded off to two decimal places).
Then I have calculated anamolies by subtracting each successive years CO2 concentration from the mean (of 20 years.)
Here a negative value shows a negative anamoly i.e. where the CO2 concentration is below the mean(of 20 years).
And a positive value shows a positive anamoly i.e. where the CO2 concentration is above the mean( of 20 years).
Below is a chart showing the anamolies in successive years.
Please note that the calculated mean is 385.15 (ppm) (rounded off to two decimal places)

After computing the above table we can compute and plot the CO2 concentration anamolies time series.
PLEASE NOTE THAT -
On the Primary Vertical Axis (left) is the absolute concentration of CO2.
On the Secondary Vertical Axis (right) is the anomaly displayed. ( 0 being the mean value. )
On the Horizontal Axis is the year.
Add Answer to:
I am trying to figure out part a, maybe then I can do b.
Thanks
(5)...
Most questions answered within 3 hours.
-
The manager at a car assembly plant believes that the mean
assembly time for a car...
asked 21 minutes ago -
Which of the following is true of electron capture?
A) It decreases the nuclide's mass number...
asked 1 hour ago -
Assuming an efficiency of 43.10%, calculate the actual yield of
magnesium nitrate formed from 114.9 g...
asked 2 hours ago -
The highly pathogenic bacterium Clostridium
perfringens causes gangrene, a disease that results in the
destruction of...
asked 4 hours ago -
In the context of situation analysis, which of the following is
a category for analysis in...
asked 4 hours ago -
In a study of the gas phase decomposition of sulfuryl chloride
at 600 K SO2Cl2(g)SO2(g) +...
asked 4 hours ago -
75 g of 2-propanol (C3H8O) and 25 g of pentane are mixed in a
200 mL...
asked 4 hours ago -
The 2800-turn coil in a dc motor has an area per turn of 1.1 ×
10-2...
asked 4 hours ago -
Draw a combinational logic circuit diagram with a symbol inside
the box for two I/P of...
asked 4 hours ago -
The cliché we use quite a lot in finance is: there is a need to
maximize...
asked 4 hours ago -
In class we discussed the addition of HCl to alpha pinene. Would
you expect one or...
asked 4 hours ago -
I'm trying to explain to my daughter to help her please help
me
I tagged the...
asked 4 hours ago