Crude oil biodegradation. Refer to the Journal of Petroleum Geology (April, 2010) study of the environmental...
Crude oil biodegradation. Refer to the Journal of
Petroleum
Geology (April, 2010) study of the environmental factors
associated with biodegradation in crude oil reservoirs,
Exercise 2.18 (p. 37). Recall that amount of dioxide
(milligrams/
liter) and presence/absence of crude oil was determined
for each of 16 water specimens collected from a mine
reservoir. The data are repeated in the accompanying table.
a. Find the mean dioxide level of the 16 water specimens.
Interpret this value.
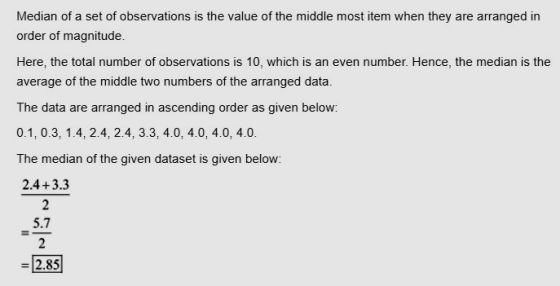
b. Find the median dioxide level of the 16 water specimens.
Interpret this value.
c. Find the mode of the 16 dioxide levels. Interpret this
value.
d. Find the median dioxide level of the 10 water specimens
with no crude oil present.
e. Find the median dioxide level of the 6 water specimens
with crude oil present.
BIODEG
MINITAB Output for Exercise 2.33
Dioxide Amount Crude Oil Present
3.3 No
0.5 Yes
1.3 Yes
0.4 Yes
0.1 No
4.0 No
0.3 No
0.2 Yes
2.4 No
2.4 No
1.4 No
0.5 Yes
0.2 Yes
4.0 No
4.0 No
4.0 No
Homework Answers
Answer:
a)

Interpretation:

b)

Interpretation:

c)

Interpretation:
The amount of dioxide which occurs frequently is 4
d)
e)

Add Answer to:
Crude oil biodegradation. Refer to the Journal of
Petroleum
Geology (April, 2010) study of the environmental...
I have this case study to solve. i want to ask which type of case study...
 I have this case study to solve. i want to ask which
type of case study in this like problem, evaluation or decision? if
its decision then what are the criterias and all?
Stardust Petroleum Sendirian Berhad: how to inculcate the pro-active safety culture? Farzana Quoquab, Nomahaza Mahadi, Taram Satiraksa Wan Abdullah and Jihad Mohammad Coming together is a beginning; keeping together is progress; working together is success. - Henry Ford The beginning Stardust was established in 2013 as a...
I have this case study to solve. i want to ask which
type of case study in this like problem, evaluation or decision? if
its decision then what are the criterias and all?
Stardust Petroleum Sendirian Berhad: how to inculcate the pro-active safety culture? Farzana Quoquab, Nomahaza Mahadi, Taram Satiraksa Wan Abdullah and Jihad Mohammad Coming together is a beginning; keeping together is progress; working together is success. - Henry Ford The beginning Stardust was established in 2013 as a...
I ONLY NEED HELP WITH PART OF PART "B" I've figured out the test statistic is...
 I ONLY NEED HELP WITH PART OF PART "B"
I've figured out the test statistic is -1.73 and the degrees of
freedom are 5. However, I'm having a hard time finding the P value
via the chart (which I'm required to learn how to do).I think the
chart immediately bellow this is the one used to find the p-value.
However, I know at least one (or more) of the charts bellow is
what's used. Please let me know which chart...
I ONLY NEED HELP WITH PART OF PART "B"
I've figured out the test statistic is -1.73 and the degrees of
freedom are 5. However, I'm having a hard time finding the P value
via the chart (which I'm required to learn how to do).I think the
chart immediately bellow this is the one used to find the p-value.
However, I know at least one (or more) of the charts bellow is
what's used. Please let me know which chart...
I ONLY NEED HELP WITH PART OF PART "B" I've figured out the test statistic is -1.73 and the degr...
 I ONLY NEED HELP WITH PART OF PART "B"
I've figured out the test statistic is -1.73 and the degrees of
freedom are 5. However, I'm having a hard time finding the P value
via the chart (which I'm required to learn how to do).I think the
chart immediately bellow this is the one used to find the p-value.
However, I know at least one (or more) of the charts bellow is
what's used. Please let me know which chart...
I ONLY NEED HELP WITH PART OF PART "B"
I've figured out the test statistic is -1.73 and the degrees of
freedom are 5. However, I'm having a hard time finding the P value
via the chart (which I'm required to learn how to do).I think the
chart immediately bellow this is the one used to find the p-value.
However, I know at least one (or more) of the charts bellow is
what's used. Please let me know which chart...
 I have this case study to solve. i want to ask which
type of case study in this like problem, evaluation or decision? if
its decision then what are the criterias and all?
Stardust Petroleum Sendirian Berhad: how to inculcate the pro-active safety culture? Farzana Quoquab, Nomahaza Mahadi, Taram Satiraksa Wan Abdullah and Jihad Mohammad Coming together is a beginning; keeping together is progress; working together is success. - Henry Ford The beginning Stardust was established in 2013 as a...
I have this case study to solve. i want to ask which
type of case study in this like problem, evaluation or decision? if
its decision then what are the criterias and all?
Stardust Petroleum Sendirian Berhad: how to inculcate the pro-active safety culture? Farzana Quoquab, Nomahaza Mahadi, Taram Satiraksa Wan Abdullah and Jihad Mohammad Coming together is a beginning; keeping together is progress; working together is success. - Henry Ford The beginning Stardust was established in 2013 as a...
 I ONLY NEED HELP WITH PART OF PART "B"
I've figured out the test statistic is -1.73 and the degrees of
freedom are 5. However, I'm having a hard time finding the P value
via the chart (which I'm required to learn how to do).I think the
chart immediately bellow this is the one used to find the p-value.
However, I know at least one (or more) of the charts bellow is
what's used. Please let me know which chart...
I ONLY NEED HELP WITH PART OF PART "B"
I've figured out the test statistic is -1.73 and the degrees of
freedom are 5. However, I'm having a hard time finding the P value
via the chart (which I'm required to learn how to do).I think the
chart immediately bellow this is the one used to find the p-value.
However, I know at least one (or more) of the charts bellow is
what's used. Please let me know which chart...
Most questions answered within 3 hours.
-
lease solve all the
questions, don't need to explanations
Q1 - All animal
species have general...
asked 2 hours ago -
Business Phasing
1.Discuss the logical progression for growing a business, which
starts from the initial idea...
asked 2 hours ago -
Modify
When executing on the command line having only
this program name, the program will accept...
asked 3 hours ago -
Kenny Electric Company's noncallable bonds were issued several
years ago and now have 20 years to...
asked 3 hours ago -
find H(e^Jtheta) at theta= 0, pi/10, pi/20, pi/2 for
the following:
a) H(e^Jtheta)= 1+e^Jtheta
b) H(e^Jtheta)=...
asked 4 hours ago -
Home Corporation will open a new store on January 1. Based on
experience from its other...
asked 4 hours ago -
In a neoclassical model, use the IS-LM to analyze the effect of
a permanent money supply...
asked 5 hours ago -
An electron passes through a point 2.67 cm from a long straight
wire as it moves...
asked 5 hours ago -
A grammar is a 4-tuple G, G = (Ν, Σ, Π, Σ, S) where, Ν is...
asked 6 hours ago -
In this part, calculate the present values. Use the Excel PV
function to compute the present...
asked 6 hours ago -
Part 1. Primitive Types, Sorting, Recursion for
Homework.java
a) Implement the static method initializeArray that receives...
asked 7 hours ago -
Using C++, build a sorter that can rank a sequence of numbers in
a descending order....
asked 7 hours ago