With matlab plot cos(0, 2pi*t) for values of t such that 3 periods of the function...
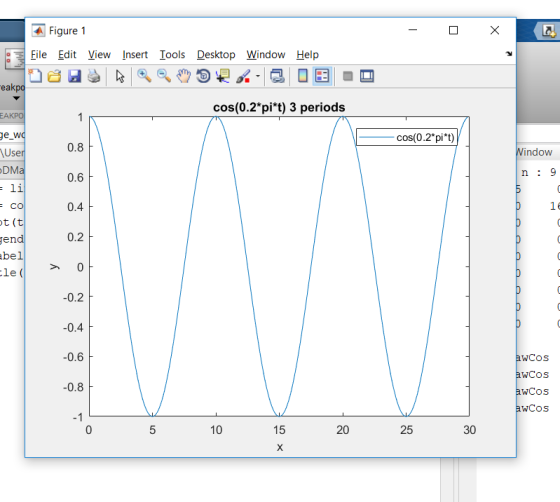
With matlab plot cos(0, 2pi*t) for values of t such that 3 periods of the function are shown Remember that Wo=0.4pi
Someone specify the use of the radian frequency in their answer
Homework Answers
please find the code below::
t = linspace(0,9.5*pi,1000);
y = cos(0.2*pi*t);
plot(t,y),
legend('cos(0.2*pi*t)'),
xlabel('x'), ylabel('y');
title('cos(0.2*pi*t) 3 periods');
output:
Add Answer to:
With matlab plot cos(0, 2pi*t) for values of t such that 3
periods of the function...
Need MatLab code Exercise: Use MATLAB to generate the sinusoidal waveform: x(t) = 3 cos(1200) Consider...
 Need MatLab code
Exercise: Use MATLAB to generate the sinusoidal waveform: x(t) = 3 cos(1200) Consider the frequency of this sinusoid and use this information to select an appropriate time-step and time array that will allow this signal to be correctly represented and displayed on a new MATLAB figure window (display 4 periods of this wave only). Now set up an appropriate frequency array and use the fft() and fftshift() functions to generate and plot the Fourier Transform (magnitude spectra)...
Need MatLab code
Exercise: Use MATLAB to generate the sinusoidal waveform: x(t) = 3 cos(1200) Consider the frequency of this sinusoid and use this information to select an appropriate time-step and time array that will allow this signal to be correctly represented and displayed on a new MATLAB figure window (display 4 periods of this wave only). Now set up an appropriate frequency array and use the fft() and fftshift() functions to generate and plot the Fourier Transform (magnitude spectra)...
In MATLAB plot the following: The function is periodic, with time period 2T=2, after t=2 the...
 In MATLAB plot the following: The function is periodic, with time period 2T=2, after t=2 the same sinusoidal components repeat in the same way as when 0 st < 2. The function its expanded from one time period 27, in terms of the sinusoidal components. All sinusoidal components have frequencies which are integral multiples of the fundamental frequency. 1 1 = = = 0.5Hz to = fo = cot I am cos(womt) + b, sin(wont) m=1 rad wo = 2nfo...
(c) Define the K partial sum approximation to z(t) as K(t)Bc( Use Matlab to evaluate and plot two periods of the K-th term in this sum and plot ax(t) for K1,3,7,29, and 99. Submit the term values,...
 (c) Define the K partial sum approximation to z(t) as K(t)Bc( Use Matlab to evaluate and plot two periods of the K-th term in this sum and plot ax(t) for K1,3,7,29, and 99. Submit the term values, the plots, and the Matlab code generated to obtain the results. xl4) -I Figure 1: Matlab Problem 1
(c) Define the K partial sum approximation to z(t) as K(t)Bc( Use Matlab to evaluate and plot two periods of the K-th term in this...
(c) Define the K partial sum approximation to z(t) as K(t)Bc( Use Matlab to evaluate and plot two periods of the K-th term in this sum and plot ax(t) for K1,3,7,29, and 99. Submit the term values, the plots, and the Matlab code generated to obtain the results. xl4) -I Figure 1: Matlab Problem 1
(c) Define the K partial sum approximation to z(t) as K(t)Bc( Use Matlab to evaluate and plot two periods of the K-th term in this...
Plot the following function on MATLAB h(t) = cos(pi*t/2) -2 <= t < -1 1 +...
Plot the following function on MATLAB h(t) = cos(pi*t/2) -2 <= t < -1 1 + t3 -1 <= t < 0 1 0 <= t < 1 1 + sin(2*pi*t) 1 <= t < 2 0 elsewhere
4. Consider the periodic function 0, -1<t<- f(t) cos(#(t + 1)), } <t< 0 cos(at), 0<t<...
 4. Consider the periodic function 0, -1<t<- f(t) cos(#(t + 1)), } <t< 0 cos(at), 0<t< 0, }<t<i with f(t) = f(t+2). (a) Determine a general expression for the Fourier series of f. (b) Use MATLAB to plot both f and the sum of the first 5 non-zero terms of the Fourier series for f on the same set of axes for -1<t<3.
To plot a figure of a function y=f(t) in an interval a and b in MATLAB,...
 To plot a figure of a function y=f(t) in an interval a and b in MATLAB, one should find n-1 points of t between a and b and then find the corresponding values to plot the figure. Below shows an example of a sin function in the range of 0 and 1 with 1000 increments, as well as the figure. >> t = 0:0.001:1; >> y = sin(2*pi*2*t); >> figure >> plot(t, y) 0 02 04 06 08 Demonstrate a...
**Using MATLAB** 0 t (s) -4 -3 -2 -1 -1 Entire an equivalent function for the plot shown here using the step function, u(t) 0 t (s) -4 -3 -2 -1 -1 Entire an equivalent function for the plot show...
 **Using MATLAB**
0 t (s) -4 -3 -2 -1 -1 Entire an equivalent function for the plot shown here using the step function, u(t)
0 t (s) -4 -3 -2 -1 -1 Entire an equivalent function for the plot shown here using the step function, u(t)
**Using MATLAB**
0 t (s) -4 -3 -2 -1 -1 Entire an equivalent function for the plot shown here using the step function, u(t)
0 t (s) -4 -3 -2 -1 -1 Entire an equivalent function for the plot shown here using the step function, u(t)
In matlab please 3. (15 Points) Consider the following function. f(t) = 5e(-31) cos(20) a. Plot...
 In matlab please
3. (15 Points) Consider the following function. f(t) = 5e(-31) cos(20) a. Plot the function for t = 0 to 1 b. Analytically calculate the derivative. C. Calculate the derivative using the diff function d. Calculate the derivative using the gradient function e. In a separate figure, plot the derivatives obtained above in a single new figure (not subplot) using (i) solid blue line for part b, (ii) red dots for part c, and (iii) green o's...
In matlab please
3. (15 Points) Consider the following function. f(t) = 5e(-31) cos(20) a. Plot the function for t = 0 to 1 b. Analytically calculate the derivative. C. Calculate the derivative using the diff function d. Calculate the derivative using the gradient function e. In a separate figure, plot the derivatives obtained above in a single new figure (not subplot) using (i) solid blue line for part b, (ii) red dots for part c, and (iii) green o's...
The continuous signal x(t) = 3 cos(2pi 70 t) is converted to a discretized signal. What...
The continuous signal x(t) = 3 cos(2pi 70 t) is converted to a discretized signal. What is the expression for the discrete signal if the sampling frequency is 200 Hz? What is the frequency of the discrete signal if it is sampled at 3Hz?
Using matlab, create a 3-D plot of the wave equation y(x,t)= cos(omega*t-beta*x) .Plot for a time...
Using matlab, create a 3-D plot of the wave equation y(x,t)= cos(omega*t-beta*x) .Plot for a time range from t=0 to t=2T and a space range of x=0 to x=2lambda
 Need MatLab code
Exercise: Use MATLAB to generate the sinusoidal waveform: x(t) = 3 cos(1200) Consider the frequency of this sinusoid and use this information to select an appropriate time-step and time array that will allow this signal to be correctly represented and displayed on a new MATLAB figure window (display 4 periods of this wave only). Now set up an appropriate frequency array and use the fft() and fftshift() functions to generate and plot the Fourier Transform (magnitude spectra)...
Need MatLab code
Exercise: Use MATLAB to generate the sinusoidal waveform: x(t) = 3 cos(1200) Consider the frequency of this sinusoid and use this information to select an appropriate time-step and time array that will allow this signal to be correctly represented and displayed on a new MATLAB figure window (display 4 periods of this wave only). Now set up an appropriate frequency array and use the fft() and fftshift() functions to generate and plot the Fourier Transform (magnitude spectra)...
 In MATLAB plot the following: The function is periodic, with time period 2T=2, after t=2 the same sinusoidal components repeat in the same way as when 0 st < 2. The function its expanded from one time period 27, in terms of the sinusoidal components. All sinusoidal components have frequencies which are integral multiples of the fundamental frequency. 1 1 = = = 0.5Hz to = fo = cot I am cos(womt) + b, sin(wont) m=1 rad wo = 2nfo...
 (c) Define the K partial sum approximation to z(t) as K(t)Bc( Use Matlab to evaluate and plot two periods of the K-th term in this sum and plot ax(t) for K1,3,7,29, and 99. Submit the term values, the plots, and the Matlab code generated to obtain the results. xl4) -I Figure 1: Matlab Problem 1
(c) Define the K partial sum approximation to z(t) as K(t)Bc( Use Matlab to evaluate and plot two periods of the K-th term in this...
(c) Define the K partial sum approximation to z(t) as K(t)Bc( Use Matlab to evaluate and plot two periods of the K-th term in this sum and plot ax(t) for K1,3,7,29, and 99. Submit the term values, the plots, and the Matlab code generated to obtain the results. xl4) -I Figure 1: Matlab Problem 1
(c) Define the K partial sum approximation to z(t) as K(t)Bc( Use Matlab to evaluate and plot two periods of the K-th term in this...
 4. Consider the periodic function 0, -1<t<- f(t) cos(#(t + 1)), } <t< 0 cos(at), 0<t< 0, }<t<i with f(t) = f(t+2). (a) Determine a general expression for the Fourier series of f. (b) Use MATLAB to plot both f and the sum of the first 5 non-zero terms of the Fourier series for f on the same set of axes for -1<t<3.
 To plot a figure of a function y=f(t) in an interval a and b in MATLAB, one should find n-1 points of t between a and b and then find the corresponding values to plot the figure. Below shows an example of a sin function in the range of 0 and 1 with 1000 increments, as well as the figure. >> t = 0:0.001:1; >> y = sin(2*pi*2*t); >> figure >> plot(t, y) 0 02 04 06 08 Demonstrate a...
 **Using MATLAB**
0 t (s) -4 -3 -2 -1 -1 Entire an equivalent function for the plot shown here using the step function, u(t)
0 t (s) -4 -3 -2 -1 -1 Entire an equivalent function for the plot shown here using the step function, u(t)
**Using MATLAB**
0 t (s) -4 -3 -2 -1 -1 Entire an equivalent function for the plot shown here using the step function, u(t)
0 t (s) -4 -3 -2 -1 -1 Entire an equivalent function for the plot shown here using the step function, u(t)
 In matlab please
3. (15 Points) Consider the following function. f(t) = 5e(-31) cos(20) a. Plot the function for t = 0 to 1 b. Analytically calculate the derivative. C. Calculate the derivative using the diff function d. Calculate the derivative using the gradient function e. In a separate figure, plot the derivatives obtained above in a single new figure (not subplot) using (i) solid blue line for part b, (ii) red dots for part c, and (iii) green o's...
In matlab please
3. (15 Points) Consider the following function. f(t) = 5e(-31) cos(20) a. Plot the function for t = 0 to 1 b. Analytically calculate the derivative. C. Calculate the derivative using the diff function d. Calculate the derivative using the gradient function e. In a separate figure, plot the derivatives obtained above in a single new figure (not subplot) using (i) solid blue line for part b, (ii) red dots for part c, and (iii) green o's...
Most questions answered within 3 hours.
-
Week 10 - Professional Memo Assignment
Professional Memo Assignment
Your mission for this week, should you...
asked 16 seconds from now -
Write a Python program that stores the data for each
player on the team, and it...
asked 9 minutes ago -
In
the last 3 months, mike never knows when he is going to get his
allowance...
asked 34 minutes ago -
Is Ca(OH)2 a Bronsted base, Lewis base, or both? Why?
asked 23 minutes ago -
1A- Why don’t voters complain about U.S. tariffs on imported
sugar?
Because sugar is only a...
asked 32 minutes ago -
Cash Payback Period
Primera Banco is evaluating two capital investment proposals for
a drive-up ATM kiosk,...
asked 31 minutes ago -
Create a button in Swift (Xcode) that will create a charge,
create a charge using Stripe's...
asked 31 minutes ago -
The reaction rate of CO and NO2 in the reaction
CO(g) + NO2(g) → CO2(g) +...
asked 32 minutes ago -
Imagine that a chemist puts 6.40 mol each of
C3H8 and O2 in a 1.00-L container...
asked 49 minutes ago -
How much money should be invested today in order to have $8340
at the end of...
asked 53 minutes ago -
You are conducting research for a hospital and issue a survey to
patients.
Based on the...
asked 53 minutes ago -
What might be a negative mutation that would hinder the
bug population?
asked 1 hour ago