
Homework Answers
clc;clear all;close all
t1=0:0.01:1;
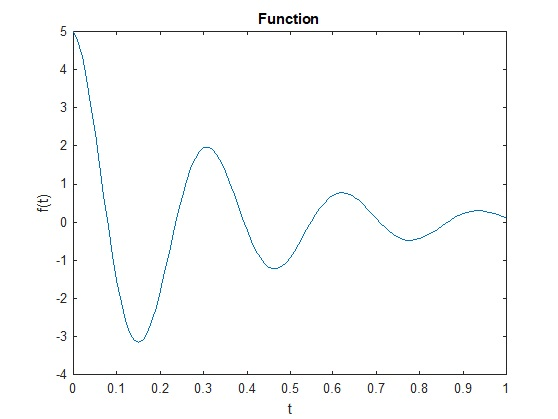
F=5*exp(-3*t1).*cos(20*t1);%Function
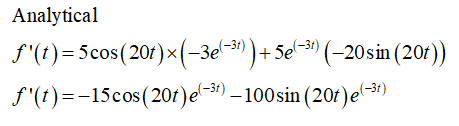
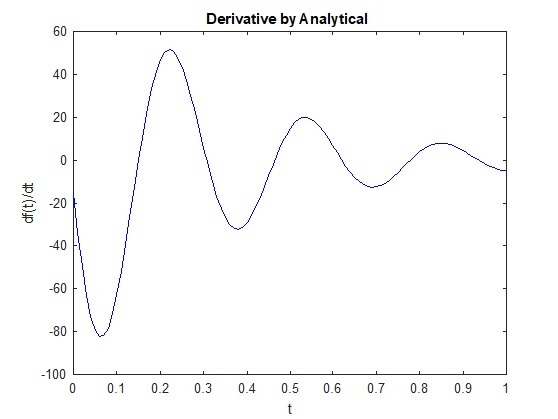
F1=-(15.*cos(20*t1).*exp(-3*t1))-(100.*sin(20*t1).*exp(-3*t1));%Analytical
derivative
syms t
f=5*exp(-3*t).*cos(20*t);%Function
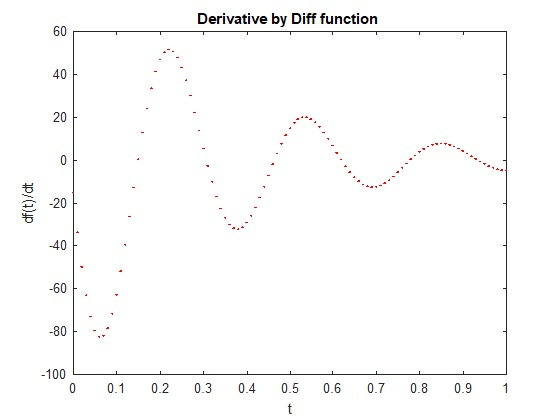
f2=diff(f);
t1=0:0.01:1;
F2=vpa(subs(f2,t,t1));
f3=gradient(f,t);
F3=vpa(subs(f3,t,t1));
figure
plot(t1,F)
xlabel('t')
ylabel('f(t)')
title('Function')
figure
plot(t1,F1,'color','b')
xlabel('t')
ylabel('df(t)/dt')
title('Derivative by Analytical')
figure
plot(t1,F2,'.','color','r')
xlabel('t')
ylabel('df(t)/dt')
title('Derivative by Diff function')
figure
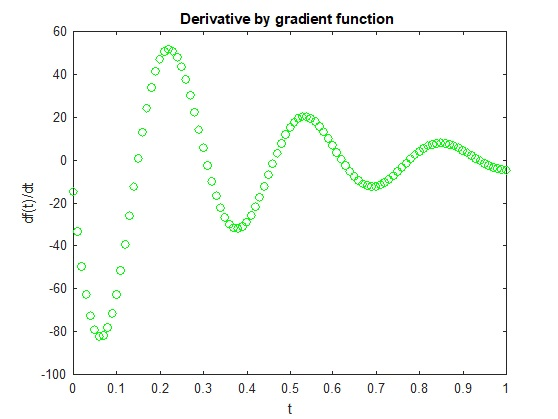
plot(t1,F1,'o','color','g')
xlabel('t')
ylabel('df(t)/dt')
title('Derivative by gradient function')
Add Answer to:
In matlab please
3. (15 Points) Consider the following function. f(t) = 5e(-31) cos(20) a. Plot...
Need help!! 1. (25 Points) In the figure below, figure (a) shows a uniform beam subject...
 Need help!!
1. (25 Points) In the figure below, figure (a) shows a uniform beam subject to a linearly increasing distributed load which starts a 0 at the left end and increases to Wo on the right end. As depicted in (b), the beam deflection can be computed with 4 120EIL where E is the modulus of elasticity [kN/cm2] and I is the moment of inertia [cm]. Calculate each of thee following quantities (take the derivatives by hand) and plot...
Need help!!
1. (25 Points) In the figure below, figure (a) shows a uniform beam subject to a linearly increasing distributed load which starts a 0 at the left end and increases to Wo on the right end. As depicted in (b), the beam deflection can be computed with 4 120EIL where E is the modulus of elasticity [kN/cm2] and I is the moment of inertia [cm]. Calculate each of thee following quantities (take the derivatives by hand) and plot...
solve all questions simply by using matlab. write all step here please 1Normal 1 No Spac Heading1 Heading 2 DISCUSSION Solve all tasks given below: 1. Consider function f(x) 3.5-0.5x cos(6x) for...
 solve all questions simply by using matlab.
write all step here please
1Normal 1 No Spac Heading1 Heading 2 DISCUSSION Solve all tasks given below: 1. Consider function f(x) 3.5-0.5x cos(6x) for the value of x between -2.0 until 4.0. Draw the plot in dash line and in red colour, Label the title and all axes. 2. Consider the following functions for 0sxS pi: x() 10e0.St sin(3t +2) y(t) 7e-04t cos(5t - 3) (a) Draw both graphs on the same...
solve all questions simply by using matlab.
write all step here please
1Normal 1 No Spac Heading1 Heading 2 DISCUSSION Solve all tasks given below: 1. Consider function f(x) 3.5-0.5x cos(6x) for the value of x between -2.0 until 4.0. Draw the plot in dash line and in red colour, Label the title and all axes. 2. Consider the following functions for 0sxS pi: x() 10e0.St sin(3t +2) y(t) 7e-04t cos(5t - 3) (a) Draw both graphs on the same...
Consider the function f(x) 1 25x which is used to test various interpolation methods. For the rem...
 Consider the function f(x) 1 25x which is used to test various interpolation methods. For the remainder of this problem consider only the interval [-1, 1] The x-values for the knots (or base-points) of the interpolation algorithm are located at x--1,-0.75, -0.5, -0.25, 0, 0.25, 0.5, 0.75 1. (a) Create a "single" figure in Matlab that contains 6 subplots (2x3) and is labelled as figure (777), i.e the figure number is 777. Plot in each subplot the function f(x) using...
MATLAB SCRIPT PLEASE Matlab MATH 210 in 2020 Homework Assignment 8- Due 3/25, 11:59PM Each...
 MATLAB SCRIPT PLEASE
Matlab MATH 210 in 2020 Homework Assignment 8- Due 3/25, 11:59PM Each plot should have its own figure associated with it. In all questions, give the figure a title, and label the acis. Save your matlab script as drill 10.m Do not use the fplot command. 1. Plot the function f(x) = (x + 5)2 for -5 <<<10. Include a plot title, and label both aris. 2. Use the subplot command to make two plots of...
MATLAB SCRIPT PLEASE
Matlab MATH 210 in 2020 Homework Assignment 8- Due 3/25, 11:59PM Each plot should have its own figure associated with it. In all questions, give the figure a title, and label the acis. Save your matlab script as drill 10.m Do not use the fplot command. 1. Plot the function f(x) = (x + 5)2 for -5 <<<10. Include a plot title, and label both aris. 2. Use the subplot command to make two plots of...
Please MATLAB for all coding with good commenting. (20) Consider the function f(x) = e* -...
 Please MATLAB for all coding with good commenting.
(20) Consider the function f(x) = e* - 3x. Using only and exactly the four points on the graph off with x-coordinates -1,0, 1 and 2, use MATLAB's polyfit function to determine a 3' degree polynomial that approximates f on the interval (-1, 2]. Plot the function f(x) and the 360 degree polynomial you have determined on the same set of axes. f must be blue and have a dashed line style,...
Please MATLAB for all coding with good commenting.
(20) Consider the function f(x) = e* - 3x. Using only and exactly the four points on the graph off with x-coordinates -1,0, 1 and 2, use MATLAB's polyfit function to determine a 3' degree polynomial that approximates f on the interval (-1, 2]. Plot the function f(x) and the 360 degree polynomial you have determined on the same set of axes. f must be blue and have a dashed line style,...
In MATLAB please Consider the nonlinear function: y = f(x) = x3 cos x a. Plot...
 In MATLAB please
Consider the nonlinear function: y = f(x) = x3 cos x a. Plot y as a function of x as x is varied between -67 and 67. In this plot mark all the locations of x where y = 0. Make sure to get all the roots in this range. You may need to zoom in to some areas of the plot. These locations are some of the roots of the above equation. b. Use the fzero...
In MATLAB please
Consider the nonlinear function: y = f(x) = x3 cos x a. Plot y as a function of x as x is varied between -67 and 67. In this plot mark all the locations of x where y = 0. Make sure to get all the roots in this range. You may need to zoom in to some areas of the plot. These locations are some of the roots of the above equation. b. Use the fzero...
Using Mathematica Consider the vector-valued function r(t)=et cos t i+(sin t)/(t+4) j +t k. a) Plot...
Using Mathematica Consider the vector-valued function r(t)=et cos t i+(sin t)/(t+4) j +t k. a) Plot the curve with t going over the interval [-2, 2]. b) Plot the curve again over the same interval, but this time add the velocity vector in blue at (1, 0, 0) to the graph. c) Plot the curve again over the same interval, along with the blue velocity vector at (1, 0, 0), but this time add the acceleration vector in red at...
Using Matlab, plot the following ultrasound pressure wave as a function of x for t =...
 Using Matlab, plot the following ultrasound pressure wave as a function of x for t = 1 P(t, x) = P_0 e^- x cos(omega t - beta x) Where alpha = 0.1 neper/m, where neper is a dimensionless quantity, beta = 1 rad/min, omega = 1 red/s, P_0 = 10 N/m^2. Submit your ".m" file as the resulting graph labeled appropriately.
3. Consider the function f(x) = cos(x) in the interval [0,8]. You are given the following 3 point...
 3. Consider the function f(x) = cos(x) in the interval [0,8]. You are given the following 3 points of this function: 10.5403 2 -0.4161 6 0.9602 (a) (2 points) Calculate the quadratic Lagrange interpolating polynomial as the sum of the Lo(x), L1(x), L2(x) polynomials we defined in class. The final answer should be in the form P)a2 bx c, but with a, b, c known. DELIVERABLES: All your work in constructing the polynomial. This is to be done by hand...
Problem 31: (34 points) 1. (10 points) A pulse width modulated (PWM) signal fPwM(t) in Figure...
 Problem 31: (34 points) 1. (10 points) A pulse width modulated (PWM) signal fPwM(t) in Figure 2. The symbol D represents a duty cycle, a number between zero and one. Determine the compact trigonometric Fourier series coefficients (Co C,11 %) of the signal f(t). 2. (10 points) One use of PWM is to generate variable DC voltages. While the PWM signal is not DC, you should be able to see from your results in part 1 that it hss a...
 Need help!!
1. (25 Points) In the figure below, figure (a) shows a uniform beam subject to a linearly increasing distributed load which starts a 0 at the left end and increases to Wo on the right end. As depicted in (b), the beam deflection can be computed with 4 120EIL where E is the modulus of elasticity [kN/cm2] and I is the moment of inertia [cm]. Calculate each of thee following quantities (take the derivatives by hand) and plot...
Need help!!
1. (25 Points) In the figure below, figure (a) shows a uniform beam subject to a linearly increasing distributed load which starts a 0 at the left end and increases to Wo on the right end. As depicted in (b), the beam deflection can be computed with 4 120EIL where E is the modulus of elasticity [kN/cm2] and I is the moment of inertia [cm]. Calculate each of thee following quantities (take the derivatives by hand) and plot...
 solve all questions simply by using matlab.
write all step here please
1Normal 1 No Spac Heading1 Heading 2 DISCUSSION Solve all tasks given below: 1. Consider function f(x) 3.5-0.5x cos(6x) for the value of x between -2.0 until 4.0. Draw the plot in dash line and in red colour, Label the title and all axes. 2. Consider the following functions for 0sxS pi: x() 10e0.St sin(3t +2) y(t) 7e-04t cos(5t - 3) (a) Draw both graphs on the same...
solve all questions simply by using matlab.
write all step here please
1Normal 1 No Spac Heading1 Heading 2 DISCUSSION Solve all tasks given below: 1. Consider function f(x) 3.5-0.5x cos(6x) for the value of x between -2.0 until 4.0. Draw the plot in dash line and in red colour, Label the title and all axes. 2. Consider the following functions for 0sxS pi: x() 10e0.St sin(3t +2) y(t) 7e-04t cos(5t - 3) (a) Draw both graphs on the same...
 Consider the function f(x) 1 25x which is used to test various interpolation methods. For the remainder of this problem consider only the interval [-1, 1] The x-values for the knots (or base-points) of the interpolation algorithm are located at x--1,-0.75, -0.5, -0.25, 0, 0.25, 0.5, 0.75 1. (a) Create a "single" figure in Matlab that contains 6 subplots (2x3) and is labelled as figure (777), i.e the figure number is 777. Plot in each subplot the function f(x) using...
 MATLAB SCRIPT PLEASE
Matlab MATH 210 in 2020 Homework Assignment 8- Due 3/25, 11:59PM Each plot should have its own figure associated with it. In all questions, give the figure a title, and label the acis. Save your matlab script as drill 10.m Do not use the fplot command. 1. Plot the function f(x) = (x + 5)2 for -5 <<<10. Include a plot title, and label both aris. 2. Use the subplot command to make two plots of...
MATLAB SCRIPT PLEASE
Matlab MATH 210 in 2020 Homework Assignment 8- Due 3/25, 11:59PM Each plot should have its own figure associated with it. In all questions, give the figure a title, and label the acis. Save your matlab script as drill 10.m Do not use the fplot command. 1. Plot the function f(x) = (x + 5)2 for -5 <<<10. Include a plot title, and label both aris. 2. Use the subplot command to make two plots of...
 Please MATLAB for all coding with good commenting.
(20) Consider the function f(x) = e* - 3x. Using only and exactly the four points on the graph off with x-coordinates -1,0, 1 and 2, use MATLAB's polyfit function to determine a 3' degree polynomial that approximates f on the interval (-1, 2]. Plot the function f(x) and the 360 degree polynomial you have determined on the same set of axes. f must be blue and have a dashed line style,...
Please MATLAB for all coding with good commenting.
(20) Consider the function f(x) = e* - 3x. Using only and exactly the four points on the graph off with x-coordinates -1,0, 1 and 2, use MATLAB's polyfit function to determine a 3' degree polynomial that approximates f on the interval (-1, 2]. Plot the function f(x) and the 360 degree polynomial you have determined on the same set of axes. f must be blue and have a dashed line style,...
 In MATLAB please
Consider the nonlinear function: y = f(x) = x3 cos x a. Plot y as a function of x as x is varied between -67 and 67. In this plot mark all the locations of x where y = 0. Make sure to get all the roots in this range. You may need to zoom in to some areas of the plot. These locations are some of the roots of the above equation. b. Use the fzero...
In MATLAB please
Consider the nonlinear function: y = f(x) = x3 cos x a. Plot y as a function of x as x is varied between -67 and 67. In this plot mark all the locations of x where y = 0. Make sure to get all the roots in this range. You may need to zoom in to some areas of the plot. These locations are some of the roots of the above equation. b. Use the fzero...
 Using Matlab, plot the following ultrasound pressure wave as a function of x for t = 1 P(t, x) = P_0 e^- x cos(omega t - beta x) Where alpha = 0.1 neper/m, where neper is a dimensionless quantity, beta = 1 rad/min, omega = 1 red/s, P_0 = 10 N/m^2. Submit your ".m" file as the resulting graph labeled appropriately.
 3. Consider the function f(x) = cos(x) in the interval [0,8]. You are given the following 3 points of this function: 10.5403 2 -0.4161 6 0.9602 (a) (2 points) Calculate the quadratic Lagrange interpolating polynomial as the sum of the Lo(x), L1(x), L2(x) polynomials we defined in class. The final answer should be in the form P)a2 bx c, but with a, b, c known. DELIVERABLES: All your work in constructing the polynomial. This is to be done by hand...
 Problem 31: (34 points) 1. (10 points) A pulse width modulated (PWM) signal fPwM(t) in Figure 2. The symbol D represents a duty cycle, a number between zero and one. Determine the compact trigonometric Fourier series coefficients (Co C,11 %) of the signal f(t). 2. (10 points) One use of PWM is to generate variable DC voltages. While the PWM signal is not DC, you should be able to see from your results in part 1 that it hss a...
Most questions answered within 3 hours.
-
The marketing class at CSUS had an average score of 150. An
educational analyst determined that...
asked 58 minutes ago -
Justin Case has purchased a $250 000 home by putting 20 % down
and taking out...
asked 1 hour ago -
1. In a labor market, marginal cost for a firm is
____________.
a. recruiting cost
b....
asked 1 hour ago -
On January 1, 2019, ABC Company issued $60,000,000 of 20-year,
10.5% bonds when the market rate...
asked 2 hours ago -
39.4% of US homes continue to use a landline in addition to cell
phone service. 3...
asked 2 hours ago -
Starting with benzene, synthesize 1-phenyl-1-butyne.
Show intermediates and reagents.
asked 3 hours ago -
Create a 32-run crossed array design with six control factors
and two noise factors such that...
asked 4 hours ago -
A 500g sample of sand from source A has the following amounts
retained on each sieve....
asked 4 hours ago -
In
your own words, please explain the essay by John Keynes wrote "The
End of Laissez...
asked 4 hours ago -
How are the matrix and pixels related? Why are smaller
pixels better for diagnostic quality?
asked 4 hours ago -
2. An AC generator has 80 rectangular loops on
its armature. Each loop is 11 cm...
asked 4 hours ago -
Please help me with this question. Consider Aldi’s current and
potential geographic markets (see Exhibit 4...
asked 4 hours ago