Need help on this Matlab problem, I do not know how to do it


Homework Answers
Note: Some time Matlab shows an error, index exceeds, if this type error happens when you run the program then close the Matlab IDE, after that run the fresh Matlab then copy and paste the program on Matlab terminal.
-----------------------------------------------------------------------------------------------------------------------------------------------------------------
Matlab code with Sample output:


![>> $% d) Display the minimum score for which HW $$ student C got the minimum score (-, hw]=min(creatematrixdata (3,:)); %% Di](http://img.homeworklib.com/questions/94371d80-3066-11eb-887b-dfd993114ab7.png?x-oss-process=image/resize,w_560)


![>> * h) For each exam sort the score in descending order from low to high with contain the indices % of the matrix [BI] - sor](http://img.homeworklib.com/questions/994a2580-3066-11eb-9f0a-c1c0ae6fadd7.png?x-oss-process=image/resize,w_560)
![>> $8 i) obtain the following output using Reshape reshape (creatematrixdata, [2,8]) ans - 20 85 65 45 80 30 95 75 155560 35](http://img.homeworklib.com/questions/99accbd0-3066-11eb-bd18-df14989a1058.png?x-oss-process=image/resize,w_560)
Simple program screenshot by given order:

![[-,hw]=min (creatematrixdata (3,:)); 8% Display the student homework number fprintf(Student C got the minimum score for home](http://img.homeworklib.com/questions/9a7d2a90-3066-11eb-835e-b1509c5bfd80.png?x-oss-process=image/resize,w_560)

Note: You can use this program individually as like the above-provided screenshot, if you wanna. I'm provide combine code of all the given requirements.
Code to copy:
% a) Create a matrix with the above data
creatematrixdata = [50 45 75 55;20 80 35 40;85 30 15 60;65 95 80 100]
%% b)The minimum score of all four homework
%% using the min function
[minimumScore,studentminimumscore]=min(min(creatematrixdata));
%% Display the minimum score of all four homework.
fprintf('Minimum score of all four homework: %d\n',minimumScore)
%% c) Display that student with the minimum
%% score overall assignment
fprintf('Student with the minimum score: ')
%% Check the condition whose score is
%% minimum
%% when minimum score is in row 1
if studentminimumscore==1
%% than display the student A
fprintf('Student A\n')
%% otherwise when student minimum score is in row 2
elseif studentminimumscore==2
%% than display the student B
fprintf('Student B\n')
%% otherwise when student minimum score is in row 3
elseif studentminimumscore==3
%% than display the student C
fprintf('Student C\n')
%% otherwise when student minimum score is in row 4
elseif studentminimumscore==4
%% than display the student D
fprintf('Student D\n')
%% end of the ifelse statement
end
%% d) Display the minimum score for which HW
%% student C got the minimum score
[~,hw]=min(creatematrixdata(3,:));
%% Display the student homework number
fprintf('Student C got the minimum score for homework HW%d\n',hw)
%% e) Calculate the standard deviation of the
%% scores for each homework
%% Display the score for each homework
fprintf('Standard deviation of the score for each homework: ')
%% Compute the standard deviation
disp(std(creatematrixdata))
%% Display the mean of the scores for each homework
fprintf('Mean of the score for each homework: ')
%% Compute the mean of the score for each homework
disp(mean(creatematrixdata))
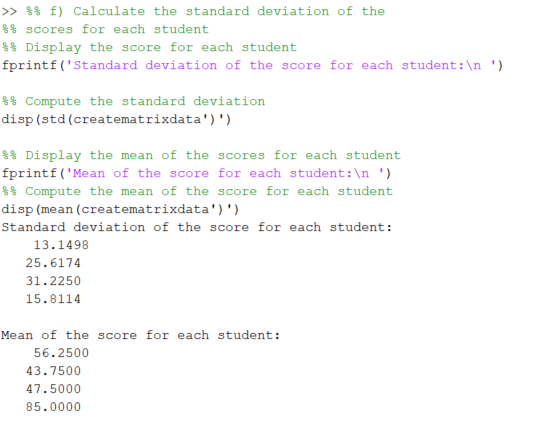
%% f) Calculate the standard deviation of the
%% scores for each student
%% Display the score for each student
fprintf('Standard deviation of the score for each student:\n ')
%% Compute the standard deviation
disp(std(creatematrixdata')')
%% Display the mean of the scores for each student
fprintf('Mean of the score for each student:\n ')
%% Compute the mean of the score for each student
disp(mean(creatematrixdata')')
%% g) find the minimum score for each exam without
%% using the min() function and create the output
% loop to access the create matrix length
for msd=1:length(creatematrixdata (1,:));
% compute the minimum score
minimumscore(msd)= creatematrixdata (1,msd);
% loop to compute the next column data
for ksd=2:length(creatematrixdata (:,1));
% check out the condition
if(minimumscore (msd)> creatematrixdata (ksd,msd))
minimumscore (msd)= creatematrixdata (ksd,msd);
end
end
end
% display the result of minimum score
minimumscore
%% h)For each exam sort the score in descending
% order from low to high with contain the indices
% of the matrix
[B,I] = sort(creatematrixdata,'descend')
%% i) obtain the following output using Reshape
reshape(creatematrixdata,[2,8])
Add Answer to:
Need help on this Matlab problem, I do not know how to do it
Problem 2....
The table below shows the midterm exam score and the overall grade for a random sample...
 The table below shows the midterm exam score and the overall grade for a random sample of 12 students in a statistics course. Calculate the value of the correlation coefficient r between midterm exam scores and overall grades. Give the answer with two decimal places. Midterm exam score Overall grade (v) 50 65 90 80 70 75 80 75 60 45 90 95 80 80 70 65 70 70 60 65 90 85 50 55
Use the Grouped Distribution method for the following exercise (see Self-Test 2-4 for detailed instructions), rounding...
Use the Grouped Distribution method for the following exercise (see Self-Test 2-4 for detailed instructions), rounding each answer to the nearest whole number. Using the frequency distribution below (scores on a statistics exam taken by 80 students), determine:ion 1 of the preliminary test (scores on a statistics exam taken by 80 students), determine: 68 84 75 82 68 90 62 88 76 93 73 79 88 73 60 93 71 59 85 75 61 65 75 87 74 62 95...
Does this data come from a normal distribution? Discuss and do an appropriate calculation. re...
Does this data come from a normal distribution? Discuss and do an appropriate calculation. result 82.5 62.5 47.5 85 62.5 57.5 72.5 55 70 42.5 52.5 22.5 52.5 35 32.5 87.5 87.5 72.5 70 70 87.5 57.5 95 70 67.5 60 35 35 77.5 87.5 97.5 75 50 52.5 60 45 80 65 62.5 35 95 37.5 30 50 95 85 70 80 50 80 92.5 65 60 27.5 62.5 35
Problem #1-Matching: Match the histograms to the summary statistics (I, II, III, or IV): Mean Median...
 Problem #1-Matching: Match the histograms to the summary statistics (I, II, III, or IV): Mean Median 52 62 III 60 IV 66 On your homework, state: Histogram A matches with (pick one: I, Il, Ill or IV) Complete for all histograms 60 57 Histogram A Histogram B 12 15 12 35 45 65 75 85 25 35 45 55 65 75 85 Histogram C Histogram D 12 12 6 30 50 70 90 110 130 40 45 50 60 65
i dont understand the gc fragmentation for this molecule. please help!! 132.0 3500 1040 3000 cq...
 i dont understand the gc fragmentation for this molecule.
please help!!
132.0 3500 1040 3000 cq H8O2 MW=149.15 2500 2000 1500 78.0 1000 51.0 500 63.0 83.8 88.9 V2-> 40 45 50 55 60 65 70 75 80 85 90 95 100 105 110 115 120 125 130 135 140
i dont understand the gc fragmentation for this molecule.
please help!!
132.0 3500 1040 3000 cq H8O2 MW=149.15 2500 2000 1500 78.0 1000 51.0 500 63.0 83.8 88.9 V2-> 40 45 50 55 60 65 70 75 80 85 90 95 100 105 110 115 120 125 130 135 140
Consider the below matrixA, which you can copy and paste directly into Matlab.
Problem #1: Consider the below matrix A, which you can copy and paste directly into Matlab. The matrix contains 3 columns. The first column consists of Test #1 marks, the second column is Test # 2 marks, and the third column is final exam marks for a large linear algebra course. Each row represents a particular student.A = [36 45 75 81 59 73 77 73 73 65 72 78 65 55 83 73 57 78 84 31 60 83...
An engineering student has the following scores in Chemistry: 95, 95, 80, 70, 77, 90, 100,...
An engineering student has the following scores in Chemistry: 95, 95, 80, 70, 77, 90, 100, 90, 65, 60, 90, 100, 90, 90, 75, 95, 30, 93, 100, 60, 85, 73, 65, 75, 45, 27, 60, 60, 39, 70. Determine: a) The frequency of each grade b) The probability of each grade c) The cumulative distribution of the probabilities d) The probability of scoring a 45 or less e) The probability of scoring a 70 or less f) The probability...
mた 731 100 417 561 60 65 70 75 40 45 50 Problem 2.9 Spectrum G...
 mた 731 100 417 561 60 65 70 75 40 45 50 Problem 2.9 Spectrum G 95 90 wavenumber (ara) Problem 3.4 G 2.7 2.6 2.5 2.4 2.3 22 2.1 2.0 19 18 1.7 1.6 15 14 1.3 12 11 1.0 09 08 ppm 95 90 85 80 75 70 65 60 55 50 45 40 35 30 25 20 15 10 ppm
8. Following are the 'Handic spectra for two isomeric hromalkancs, A and B (compon following page) with molecular...
 8. Following are the 'Handic spectra for two isomeric hromalkancs, A and B (compon following page) with molecular formula C.H.Br. Draw their structure. (compound B is on the 1Η COCI (Solvent) www wwwwwwwwwwwwww 95 90 85 80 75 70 wwww 60 55 50 45 65 40 35 30 25 20 15 10 CDCI (Solvent) TMS 95 90 RS 80 75 70 65 60 55 50 45 40 35 30 25 20 15 10 5 0 -5 -10
 The table below shows the midterm exam score and the overall grade for a random sample of 12 students in a statistics course. Calculate the value of the correlation coefficient r between midterm exam scores and overall grades. Give the answer with two decimal places. Midterm exam score Overall grade (v) 50 65 90 80 70 75 80 75 60 45 90 95 80 80 70 65 70 70 60 65 90 85 50 55
 Problem #1-Matching: Match the histograms to the summary statistics (I, II, III, or IV): Mean Median 52 62 III 60 IV 66 On your homework, state: Histogram A matches with (pick one: I, Il, Ill or IV) Complete for all histograms 60 57 Histogram A Histogram B 12 15 12 35 45 65 75 85 25 35 45 55 65 75 85 Histogram C Histogram D 12 12 6 30 50 70 90 110 130 40 45 50 60 65
 i dont understand the gc fragmentation for this molecule.
please help!!
132.0 3500 1040 3000 cq H8O2 MW=149.15 2500 2000 1500 78.0 1000 51.0 500 63.0 83.8 88.9 V2-> 40 45 50 55 60 65 70 75 80 85 90 95 100 105 110 115 120 125 130 135 140
i dont understand the gc fragmentation for this molecule.
please help!!
132.0 3500 1040 3000 cq H8O2 MW=149.15 2500 2000 1500 78.0 1000 51.0 500 63.0 83.8 88.9 V2-> 40 45 50 55 60 65 70 75 80 85 90 95 100 105 110 115 120 125 130 135 140
 mた 731 100 417 561 60 65 70 75 40 45 50 Problem 2.9 Spectrum G 95 90 wavenumber (ara) Problem 3.4 G 2.7 2.6 2.5 2.4 2.3 22 2.1 2.0 19 18 1.7 1.6 15 14 1.3 12 11 1.0 09 08 ppm 95 90 85 80 75 70 65 60 55 50 45 40 35 30 25 20 15 10 ppm
 8. Following are the 'Handic spectra for two isomeric hromalkancs, A and B (compon following page) with molecular formula C.H.Br. Draw their structure. (compound B is on the 1Η COCI (Solvent) www wwwwwwwwwwwwww 95 90 85 80 75 70 wwww 60 55 50 45 65 40 35 30 25 20 15 10 CDCI (Solvent) TMS 95 90 RS 80 75 70 65 60 55 50 45 40 35 30 25 20 15 10 5 0 -5 -10
Most questions answered within 3 hours.
-
Define Diet counceling? What are the
responsibilities of a counselor?
asked 50 minutes ago -
Hey im just confused about how to put the ' A angle n' and ' S...
asked 50 minutes ago -
A short essay about the WSJ article on Oreo versus Hydrox.
asked 52 minutes ago -
##8. A program contains the following function definition:
##def cube(num):
##return num * num * num...
asked 58 minutes ago -
find the value z of a standard Normal variable that satisfies
each of the given conditions....
asked 1 hour ago -
"banana".find('z')
Out[22]: -1
why is this -1
python 3.7
asked 1 hour ago -
Ilegal Consideration Marna Balin was involved in two automobile
accidents in which she suffered severe injures.She...
asked 1 hour ago -
Walk through the operation of QuickSort when n = 7 and the input
array is A...
asked 1 hour ago -
Answer with True or False. Argue the answers
7) The circulation of field B on any...
asked 1 hour ago -
Chase Co. uses the perpetual inventory method. The inventory
records for Chase reflected the following
Jan...
asked 1 hour ago -
what are is the correct compression for these two ipv6 ips.. i
keep getting them wrong...
asked 1 hour ago -
How does the amount of silica gel used change separation?
asked 1 hour ago