
Homework Answers

Add Answer to:
6. a) The hydrograph observed at the outlet of a basin of area 160 km2 is...
10 5 The total rainfall hyetograph of a storm, which took place over a basin is...
 10 5 The total rainfall hyetograph of a storm, which took place over a basin is given below. Ordinates of Total Storm Hydrograph (TSH) obtained for the basin is given in the table below. The baseflow is constant and is 3 m/s. If the depth of excess rainfall is 6 cm, determine: a) depth of direct runoff, i (mm/hr) b) depth of infiltrated water, c) -index, d) equation of surface runoff hydrograph in terms of UH3 and lag times. e)...
hydrology Have 30mins Q1) (25 Points) Discharge of total flood hydrograph is given below. Basin area...
 hydrology
Have 30mins
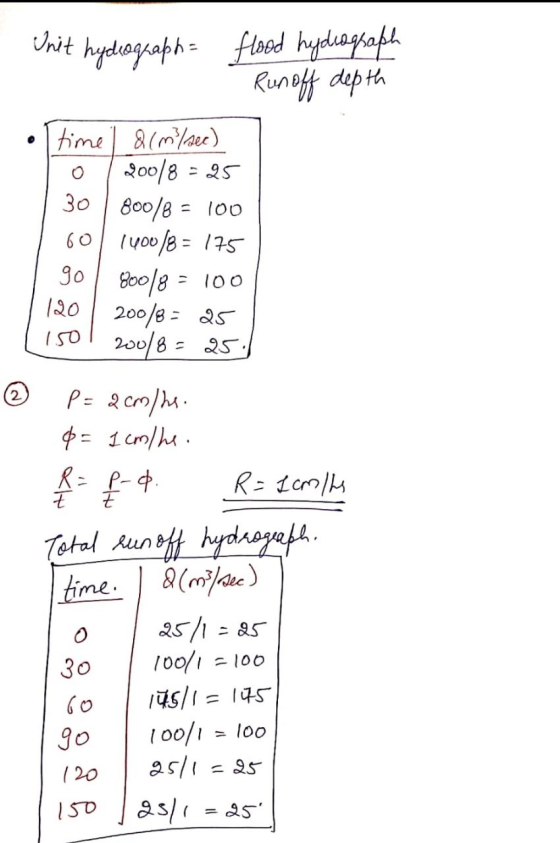
Q1) (25 Points) Discharge of total flood hydrograph is given below. Basin area is 100 km2, precipitation intensity is 80 mm/hr and the infiltration rate is 20 mm/hr. If the base flow is 100 m3/sec, then find the unit hydrograph and duration of precipitation. The total flood hydrograph is given in Table 1 and drawn below. Table 1. Total Flood Hydrograph 40 60 80 100 0 20 120 140 160 t(minutes) Q(m3/sec) 100 700 610 520 430...
hydrology
Have 30mins
Q1) (25 Points) Discharge of total flood hydrograph is given below. Basin area is 100 km2, precipitation intensity is 80 mm/hr and the infiltration rate is 20 mm/hr. If the base flow is 100 m3/sec, then find the unit hydrograph and duration of precipitation. The total flood hydrograph is given in Table 1 and drawn below. Table 1. Total Flood Hydrograph 40 60 80 100 0 20 120 140 160 t(minutes) Q(m3/sec) 100 700 610 520 430...
3 and 4 3. Discharge rates for a flood hydrograph passing the outlet of a 600-acre...
 3 and 4
3. Discharge rates for a flood hydrograph passing the outlet of a 600-acre drainage basin is given below. The flood was produced by a uniform rainfall rate of 2.75 in/hr, which started at 9 am and ended abruptly at 11 am. Time (hr)Q (cfs) 8:00 AM100 9:00 AM100 10:00 AM 300 11:00 AM 500 12:00 PM 700 1:00 PM800 2:00 PM600 3:00 PM400 4:00 PM 300 5:00 PM 6:00 PM 100 7:00 PM100 200 a) At what...
3 and 4
3. Discharge rates for a flood hydrograph passing the outlet of a 600-acre drainage basin is given below. The flood was produced by a uniform rainfall rate of 2.75 in/hr, which started at 9 am and ended abruptly at 11 am. Time (hr)Q (cfs) 8:00 AM100 9:00 AM100 10:00 AM 300 11:00 AM 500 12:00 PM 700 1:00 PM800 2:00 PM600 3:00 PM400 4:00 PM 300 5:00 PM 6:00 PM 100 7:00 PM100 200 a) At what...
2. Refer to the rainfall and streamflow data tabulated below for the area of 280 [km]. Time Observed Gross hPrecipitation (GRH) [cm/h] 0.25 3.00 2.75 Time (h) Hydrograph 160 150 350 800 025 1200 4 90...
 2. Refer to the rainfall and streamflow data tabulated below for the area of 280 [km]. Time Observed Gross hPrecipitation (GRH) [cm/h] 0.25 3.00 2.75 Time (h) Hydrograph 160 150 350 800 025 1200 4 900 700 550 350 250 160 140 10 (a) Obtain an Unit Hydrograph (UH) of these series. In this process, use the horizontal straight-line method to separate baseflow. [10pt] (b) Can you also transfer the UH obtained from (a) to the 6-hour UH for this...
A 6 hr storm produced rainfall intensities of 7, 18, 25, 12, 10 and 3 mm/hr...
A 6 hr storm produced rainfall intensities of 7, 18, 25, 12, 10 and 3 mm/hr in successive one hour 2 intervals over a basin of 800 Km . The resulting runoff is observed to be 2640 hectare-meters. Determine φ-index for the basin. A 6 hr storm produced rainfall intensities of 7, 18, 25, 12, 10 and 3 mm/hr in successive one hour 2 intervals over a basin of 800 Km . The resulting runoff is observed to be 2640...
2. A 10-minute unit hydrograph (UH) of a catchment is given in the table below. What...
 2. A 10-minute unit hydrograph (UH) of a catchment is given in the table below. What is the catchment area? (5 marks) Time step (10 minutes) 1 2 3 4 Discharge (mº/{s.cm)) 8 18 30 10 For a storm partern given in the table below, determine and plot runoff hydrograph at a 5-minute interval using the above 10-minute UH. Determine the time of concentration of the catchment. Assume the o index value for the catchment to be 12 mm/hr, and...
ENGINEERING HYDROLOGY CIVL431 Assignment1 Problem 11 The following data were observed at Demirkopru Dam site on...
 ENGINEERING HYDROLOGY CIVL431 Assignment1 Problem 11 The following data were observed at Demirkopru Dam site on Gedir River in June 1971. Find the monthly evaporation in mm from the reservoir surface of this dam. If there were a Class A pan installed nearby the reservoir, what would be the monthly evaporation observed from this pan? Storage at the beginning of the month 4XY.X-10 m Storage at the end of the month 47XY -10 m Average surface area of reservoir in...
ENGINEERING HYDROLOGY CIVL431 Assignment #1 Problem 11 The following data were observed at Demirköprü Dam site...
 ENGINEERING HYDROLOGY CIVL431 Assignment #1 Problem 11 The following data were observed at Demirköprü Dam site on Gediz River in June 1971. Find the monthly evaporation in mm from the reservoir surface of this dam. If there were a Class A pan installed nearby the reservoir, what would be the monthly evaporation observed from this pan? Storage at the beginning of the month : 4XY.Z - 10 m Storage at the end of the month 47x V -10 m Average...
 10 5 The total rainfall hyetograph of a storm, which took place over a basin is given below. Ordinates of Total Storm Hydrograph (TSH) obtained for the basin is given in the table below. The baseflow is constant and is 3 m/s. If the depth of excess rainfall is 6 cm, determine: a) depth of direct runoff, i (mm/hr) b) depth of infiltrated water, c) -index, d) equation of surface runoff hydrograph in terms of UH3 and lag times. e)...
 hydrology
Have 30mins
Q1) (25 Points) Discharge of total flood hydrograph is given below. Basin area is 100 km2, precipitation intensity is 80 mm/hr and the infiltration rate is 20 mm/hr. If the base flow is 100 m3/sec, then find the unit hydrograph and duration of precipitation. The total flood hydrograph is given in Table 1 and drawn below. Table 1. Total Flood Hydrograph 40 60 80 100 0 20 120 140 160 t(minutes) Q(m3/sec) 100 700 610 520 430...
hydrology
Have 30mins
Q1) (25 Points) Discharge of total flood hydrograph is given below. Basin area is 100 km2, precipitation intensity is 80 mm/hr and the infiltration rate is 20 mm/hr. If the base flow is 100 m3/sec, then find the unit hydrograph and duration of precipitation. The total flood hydrograph is given in Table 1 and drawn below. Table 1. Total Flood Hydrograph 40 60 80 100 0 20 120 140 160 t(minutes) Q(m3/sec) 100 700 610 520 430...
 3 and 4
3. Discharge rates for a flood hydrograph passing the outlet of a 600-acre drainage basin is given below. The flood was produced by a uniform rainfall rate of 2.75 in/hr, which started at 9 am and ended abruptly at 11 am. Time (hr)Q (cfs) 8:00 AM100 9:00 AM100 10:00 AM 300 11:00 AM 500 12:00 PM 700 1:00 PM800 2:00 PM600 3:00 PM400 4:00 PM 300 5:00 PM 6:00 PM 100 7:00 PM100 200 a) At what...
3 and 4
3. Discharge rates for a flood hydrograph passing the outlet of a 600-acre drainage basin is given below. The flood was produced by a uniform rainfall rate of 2.75 in/hr, which started at 9 am and ended abruptly at 11 am. Time (hr)Q (cfs) 8:00 AM100 9:00 AM100 10:00 AM 300 11:00 AM 500 12:00 PM 700 1:00 PM800 2:00 PM600 3:00 PM400 4:00 PM 300 5:00 PM 6:00 PM 100 7:00 PM100 200 a) At what...
 2. Refer to the rainfall and streamflow data tabulated below for the area of 280 [km]. Time Observed Gross hPrecipitation (GRH) [cm/h] 0.25 3.00 2.75 Time (h) Hydrograph 160 150 350 800 025 1200 4 900 700 550 350 250 160 140 10 (a) Obtain an Unit Hydrograph (UH) of these series. In this process, use the horizontal straight-line method to separate baseflow. [10pt] (b) Can you also transfer the UH obtained from (a) to the 6-hour UH for this...
 2. A 10-minute unit hydrograph (UH) of a catchment is given in the table below. What is the catchment area? (5 marks) Time step (10 minutes) 1 2 3 4 Discharge (mº/{s.cm)) 8 18 30 10 For a storm partern given in the table below, determine and plot runoff hydrograph at a 5-minute interval using the above 10-minute UH. Determine the time of concentration of the catchment. Assume the o index value for the catchment to be 12 mm/hr, and...
 ENGINEERING HYDROLOGY CIVL431 Assignment1 Problem 11 The following data were observed at Demirkopru Dam site on Gedir River in June 1971. Find the monthly evaporation in mm from the reservoir surface of this dam. If there were a Class A pan installed nearby the reservoir, what would be the monthly evaporation observed from this pan? Storage at the beginning of the month 4XY.X-10 m Storage at the end of the month 47XY -10 m Average surface area of reservoir in...
 ENGINEERING HYDROLOGY CIVL431 Assignment #1 Problem 11 The following data were observed at Demirköprü Dam site on Gediz River in June 1971. Find the monthly evaporation in mm from the reservoir surface of this dam. If there were a Class A pan installed nearby the reservoir, what would be the monthly evaporation observed from this pan? Storage at the beginning of the month : 4XY.Z - 10 m Storage at the end of the month 47x V -10 m Average...
 ENGINEERING HYDROLOGY CIVL431 Assignment #1 Problem 11 The following data were observed at Demirköprü Dam site on Gediz River in June 1971. Find the monthly evaporation in mm from the reservoir surface of this dam. If there were a Class A pan installed nearby the reservoir, what would be the monthly evaporation observed from this pan? Storage at the beginning of the month : 4XY.Z - 10 m Storage at the end of the month 47x V -10 m Average...
Most questions answered within 3 hours.
-
Assume Kw = 1.01 ✕ 10−14
For pure water, we can calculate [H3O+ ] = [OH...
asked 41 minutes ago -
Suppose that on a temperature scale X, water boils at 203.0°X
and freezes at -105.7°X. What...
asked 1 hour ago -
BaS crystallizes in a cubic unit cell with S2- ions on each
corner and each face....
asked 2 hours ago -
A. 0≤P(Oi)≤10≤P(Oi)≤1 for each i
B. P(Oi)≤0P(Oi)≤0
C. P(Oi)=1+P(OCi)P(Oi)=1+P(OiC)
D. P(Oi)≥1P(Oi)≥1
If an experiment consists of...
asked 3 hours ago -
A battery has an emf of 9.20V and an internal resistance of 1.20
ohm. a)What resistance...
asked 3 hours ago -
The area of an elastic circular loop decreases at a constant
rate, dA/dt = −6.60×10⁻³ m2/s...
asked 4 hours ago -
The denaturation of proteins can be described by the
equilibrium
F⇌U
where F and U represent...
asked 6 hours ago -
Please answer what the maximum and minimum force is, and the
angle on the ion is...
asked 6 hours ago -
implement a program that reads a number of rows and a symbol.
The program will draw...
asked 6 hours ago -
Assume that when adults with smartphones are randomly selected,
45% use them in meetings or classes....
asked 6 hours ago -
Determine the number of formula units of
Na2SO4 and moles of oxygen contained in 8.11
moles...
asked 6 hours ago -
Explain in steps on the following code
What would be the output when executed
using System;...
asked 6 hours ago