In this study, participants were randomly assigned to one of two groups – to watch either...
|
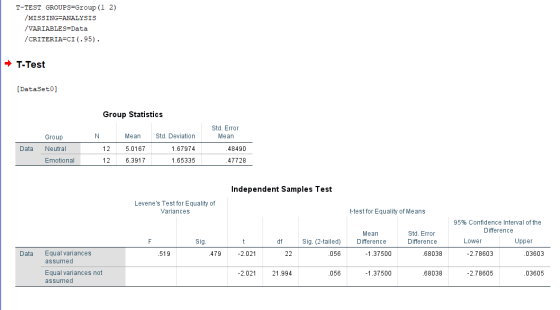
In this study, participants were randomly assigned to one of two groups – to watch either a NEUTRAL or EMOTIONAL movie clip. After watching for an hour, participants were asked to rate work place satisfaction using an inventory that ranges from 0 – 10 (with higher indicating higher satisfaction). Assume data meets all assumptions for a parametric test. Using the information provided, create an SPSS data file and conduct the appropriate statistical test to determine whether there is a statistically significant difference in watching neutral or emotional movie clips before rating work place satisfaction. Answer the following questions based on your analyses.
|
||||||||||||||||||||||||||||
|
18) |
What is your dependent variable? |
|||||||||||||||||||||||||||
|
Answer: |
||||||||||||||||||||||||||||
|
19) |
What is the scale of measurement of the independent variable? |
|||||||||||||||||||||||||||
|
Answer: |
||||||||||||||||||||||||||||
|
20) |
Paste the output of your statistical analysis below. 3 pts |
|||||||||||||||||||||||||||
|
21) |
Create an appropriate graph based on the data and paste it below (make sure to have axes labels and error bars). 3 pts |
|||||||||||||||||||||||||||
|
22) |
Write a brief results section in APA format, referring to the table. If relevant, provide the confidence interval and effect size. Remember to specifically state whether you reject or fail to reject the null hypothesis. 3 pts |
|||||||||||||||||||||||||||
|
Answer: |
||||||||||||||||||||||||||||
Homework Answers
18) rating work place satisfaction
19) ratio
20) The output is:
21) The graph is:

Add Answer to:
In this study, participants were randomly assigned to one of two
groups – to watch either...
In this study, participants were randomly assigned to one of two situations – “stress” or “no...
In this study, participants were randomly assigned to one of two situations – “stress” or “no stress”. They were then put into their assigned fictitious situation and after an hour, were asked to provide an appetite score (Likert-rating). The following data are appetite scores (with higher indicating more of an appetite / i.e. the person is hungry) from 24 participants. Assume data meets all assumptions for a parametric test. Using the information provided, create an SPSS data file and conduct...
Problem Set 1: The One-way ANOVA Research Scenario: Depressed patients are randomly assigned to 1 of 3 therapists. At th...
Problem Set 1: The One-way ANOVA Research Scenario: Depressed patients are randomly assigned to 1 of 3 therapists. At the end of 3 months, each patient completes a standardized test of depression (higher scores indicate higher level of depression). The patients’ scores are shown below. Analyze the data to determine how effective these 3 therapists are at treating depression (assume that before the treatment, all 3 groups of patients had the same average depression score). Using this table, enter the...
1. A research study randomly assigned participants into two groups. One group was given Vitamin E...
 1. A research study randomly assigned participants into two groups. One group was given Vitamin E to take daily. The other group received only a placebo pill. The research study followed the participants for eight years. After the eight years, the proportion of each group that developed a particular type of cancer was compared. What is the primary reason that the study used random assignment? a. To ensure that the groups are similar in all respects except for the level...
SPSS Homework 1 Instructions: Review and One-Way ANOVAs (40 points) Please note that for all problems...
SPSS Homework 1 Instructions: Review and One-Way ANOVAs (40 points) Please note that for all problems in this course, the standard cut-off (alpha) for a test of significance will be .05, and you always report the exact power unless SPSS output states p=.000 (you’d report p<.001). Also, remember that we divide the p value in half when reporting one-tailed tests with 1 – 2 groups. Problem Set 2: Pearson’s correlation (7 pts) Research Scenario: Is there a positive relationship between...
Part 2 – SPSS APPLICATION from this week’s assigned readings and presentations (28 pts) Problem Set...
Part 2 – SPSS APPLICATION from this week’s assigned readings and presentations (28 pts) Problem Set 1: The independent-samples t test (7 pts) Research Scenario: A clinical psychologist is studying whether there is a difference between veterans diagnosed with PTSD and veterans without PTSD in reduction of anxiety after aerobic exercise. All veterans in this study agree to complete 30 minutes of aerobic exercise 5 days a week for 4 weeks and began with similar levels of reported anxiety. Scores...
Problem Set 2: Two-way mixed design ANOVA (8 pts) Research Scenario: A researcher is attempting to determine the eff...
Problem Set 2: Two-way mixed design ANOVA (8 pts) Research Scenario: A researcher is attempting to determine the effects of age and sleep deprivation on a reaction time task. Participants (5 “old”; 5 “young”) in an experiment are given a computerized search task. They search a computer screen of various characters and attempt to find a particular character on each trial. When they find the designated character, they press a button to stop a timer. Their reaction time (in ms)...
The following are salaries from 24 human resource managers. Using the raw measurement data presented, determine...
The following are salaries from 24 human resource managers. Using the raw measurement data presented, determine whether there is a statistically significant difference between the salaries of female and male human resource managers. Create an SPSS data file and conduct the appropriate statistical test. Answer the following questions based on your analyses. Females Males 50000 55000 55000 63000 71000 53000 68000 70000 52000 69000 58000 60000 54000 58000 67000 69000 72000 73000 75000 67000 53000 61000 56000 52000 Write...
Part II: SPSS Application These questions require the use of SPSS. Remember you must submit all of your work within this word document. You will need to take a screen shot of your data view if ne...
Part II: SPSS Application These questions require the use of SPSS. Remember you must submit all of your work within this word document. You will need to take a screen shot of your data view if necessary, or copy and paste your output into the spaces below. Remember to report the exact p value provided by SPSS output – simply reporting p<.05 or p>.05 is not acceptable (unless SPSS output states p=.000 – in that case you can report p<.001)....
Part II: SPSS Application These questions require the use of SPSS. Remember you must submit all...
Part II: SPSS Application These questions require the use of SPSS. Remember you must submit all of your work within this word document. You will need to take a screen shot of your data view if necessary, or copy and paste your output into the spaces below. Remember to report the exact p value provided by SPSS output – simply reporting p<.05 or p>.05 is not acceptable (unless SPSS output states p=.000 – in that case you can report p<.001)....
 1. A research study randomly assigned participants into two groups. One group was given Vitamin E to take daily. The other group received only a placebo pill. The research study followed the participants for eight years. After the eight years, the proportion of each group that developed a particular type of cancer was compared. What is the primary reason that the study used random assignment? a. To ensure that the groups are similar in all respects except for the level...
Most questions answered within 3 hours.
-
Calculate the equillibrium constent K for a redox reaction that
has E°cell = -.98 V at...
asked 6 minutes ago -
A concave spherical mirror has a radius of curvature of
magnitude 19.6 cm.
(a) Find the...
asked 8 minutes ago -
3. draw a diagram of the magnetic field:
a. around a long straight wire with a...
asked 6 minutes ago -
If you titrated 30.0 mL of 0.1 M HCl with 0.1 M NaOH, indicate
the approximate...
asked 15 minutes ago -
NADH passes electrons into the electron transport chain. List
the carriers that would receive the electrons,...
asked 23 minutes ago -
A cylindrical cable with a resistivity of 1.6x10⁻⁸ Ω·m and cross
sectional area of 3x10⁻⁵ m^2...
asked 23 minutes ago -
True or False.
A consumer with convex preferences who is indifferent between
the bundles (5,2) and...
asked 26 minutes ago -
A diamond's index of refraction for red light, 656 nm, is 2.410,
while that for blue...
asked 39 minutes ago -
Compare HPLC, SPE, and GC. Identify the differences, the
advantages, and the weaknesses of each method.
asked 41 minutes ago -
Characteristic x-rays emitted by potassium have a wavelength of
0.374 nm. What is the energy of...
asked 43 minutes ago -
there is a function to create two random numbers between 1 and
25 and a function...
asked 1 hour ago -
At a certain temperature, the ?pKp for the decomposition of
H2SH2S is 0.832.0.832.
H2S(g)↽−−⇀H2(g)+S(g)H2S(g)↽−−⇀H2(g)+S(g)
Initially, only...
asked 55 minutes ago