SPSS Homework 1 Instructions: Review and One-Way ANOVAs (40 points) Please note that for all problems...
SPSS Homework 1 Instructions: Review and One-Way ANOVAs (40 points)
Please note that for all problems in this course, the standard cut-off (alpha) for a test of significance will be .05, and you always report the exact power unless SPSS output states p=.000 (you’d report p<.001). Also, remember that we divide the p value in half when reporting one-tailed tests with 1 – 2 groups.
|
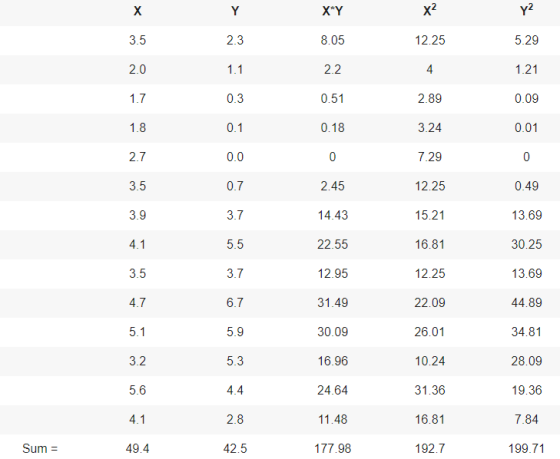
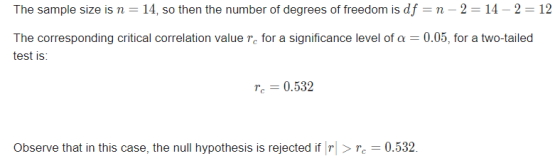
Problem Set 2: Pearson’s correlation (7 pts) Research Scenario: Is there a positive relationship between grit and dieting success? A researcher examined this issue by having people complete a grit inventory using a Likert-based scale (range 1 – 7), where higher numbers indicate more “grit”. Dieting success was measured using a likert-based inventory as well, with higher numbers indicating more success (range 1-7). Enter the data shown here into SPSS to run an analysis to test whether increased grit is associated with higher dieting success.
|
- Paste relevant SPSS output. (2 pts)
- Create an appropriate graph to display this data. (2 pts)
- Write an APA-style Results section based on your analysis. All homework “Results sections” should follow the examples provided in the presentations and textbooks. They should include the statistical statement within a complete sentence that mentions the type of test conducted, whether the test was significant, and if relevant, coefficient of determination and its interpretation. Don’t forget to include a decision about the null hypothesis. (3 pts)
|
Problem Set 3: One-Way Randomized ANOVA (7 pts) Research Scenario: A developmental psychologist is looking into the effects of play group size on empathy in four year old children. She divides the children into three separate groups for the semester during structured free time: play alone (n = 8), dyads (n = 8), or groups of 4 (n = 8). At the end of the semester, empathy is measured using the Young Children’s Empathy Measure during the parent-teacher conference (Poresky, 1990), which uses an accuracy scale of 0 – 4, with higher scores indicating more cognitive and affective empathy. The scores for each group are shown in the table below. Input the data into SPSS (remember you will enter the data only using 2 columns – one for group (make sure you label the values) and one for empathy. Conduct a one-way ANOVA to determine the effect of these different play group assignments on empathy.
|
- Paste relevant SPSS output. (2 pt)
- Create an appropriate graph to display this data. (2 pts)
- Write an APA-style Results section based on your analysis. All homework “Results sections” should follow the examples provided in the presentations and textbooks. They should include the statistical statement within a complete sentence that mentions the type of test conducted, whether the test was significant, and if relevant, effect size and/or post hoc analyses. Don’t forget to include a decision about the null hypothesis. (3 pts)
Homework Answers


2)


Add Answer to:
SPSS Homework 1 Instructions: Review and One-Way ANOVAs
(40 points)
Please note that for all problems...
Please note that for all problems in this course, the standard cut-off (alpha) for a test...
Please note that for all problems in this course, the standard cut-off (alpha) for a test of significance will be .05, and you always report the exact power unless SPSS output states p=.000 (you’d report p<.001). Also, remember when hand-calculating, always use TWO decimal places so that deductions in grading won’t be due to rounding differences. Problem Set 2: Chi Square Test of Independence A public opinion poll surveyed a sample of 100 volunteers. Respondents were classified by gender (male...
Part 2 – SPSS APPLICATION from this week’s assigned readings and presentations (28 pts) Problem Set...
Part 2 – SPSS APPLICATION from this week’s assigned readings and presentations (28 pts) Problem Set 1: The independent-samples t test (7 pts) Research Scenario: A clinical psychologist is studying whether there is a difference between veterans diagnosed with PTSD and veterans without PTSD in reduction of anxiety after aerobic exercise. All veterans in this study agree to complete 30 minutes of aerobic exercise 5 days a week for 4 weeks and began with similar levels of reported anxiety. Scores...
Problem Set 2: Two-way mixed design ANOVA (8 pts) Research Scenario: A researcher is attempting to determine the eff...
Problem Set 2: Two-way mixed design ANOVA (8 pts) Research Scenario: A researcher is attempting to determine the effects of age and sleep deprivation on a reaction time task. Participants (5 “old”; 5 “young”) in an experiment are given a computerized search task. They search a computer screen of various characters and attempt to find a particular character on each trial. When they find the designated character, they press a button to stop a timer. Their reaction time (in ms)...
Problem Set 1: The One-way ANOVA Research Scenario: Depressed patients are randomly assigned to 1 of 3 therapists. At th...
Problem Set 1: The One-way ANOVA Research Scenario: Depressed patients are randomly assigned to 1 of 3 therapists. At the end of 3 months, each patient completes a standardized test of depression (higher scores indicate higher level of depression). The patients’ scores are shown below. Analyze the data to determine how effective these 3 therapists are at treating depression (assume that before the treatment, all 3 groups of patients had the same average depression score). Using this table, enter the...
Part II: SPSS Application These questions require the use of SPSS. Remember you must submit all...
Part II: SPSS Application These questions require the use of SPSS. Remember you must submit all of your work within this word document. You will need to take a screen shot of your data view if necessary, or copy and paste your output into the spaces below. Remember to report the exact p value provided by SPSS output – simply reporting p<.05 or p>.05 is not acceptable (unless SPSS output states p=.000 – in that case you can report p<.001)....
Part II: SPSS Application These questions require the use of SPSS. Remember you must submit all of your work within this word document. You will need to take a screen shot of your data view if ne...
Part II: SPSS Application These questions require the use of SPSS. Remember you must submit all of your work within this word document. You will need to take a screen shot of your data view if necessary, or copy and paste your output into the spaces below. Remember to report the exact p value provided by SPSS output – simply reporting p<.05 or p>.05 is not acceptable (unless SPSS output states p=.000 – in that case you can report p<.001)....
Problem Set 2: Research Scenario: In a clinic that focuses on helping victims of domestic minor...
 Problem Set 2: Research Scenario: In a clinic that focuses on helping victims of domestic minor sex trafficking (DMST), a team of social workers wants to compare the differential effects of treatments for complex trauma. They divide 21 participants into three groups (n = 7 each) that do not differ significantly from one another in terms of pre-treatment trauma symptomology. One group receives Trauma-Focused Cognitive-Behavioral Therapy (TFCBT), one receives Experiential Group Therapy (EGT), and one receives a combination of the...
Problem Set 1: The independent-samples t test Research Scenario: A learning psychologist is interested in comparing the success of two different mnemonics (memorization methods) on performance in a me...
Problem Set 1: The independent-samples t test Research Scenario: A learning psychologist is interested in comparing the success of two different mnemonics (memorization methods) on performance in a memory task. He assigns students to two groups, one which learns and uses a language-based rhyming memory technique, and one which learns and uses a visual “method of loci” spatial memory technique. He then administers a memory task to each group of students. The students are scored based on the percentage of...
Problem Set 3: (9 pts) This study investigated the cognitive effects of stimulant medication in children...
Problem Set 3: (9 pts) This study investigated the cognitive effects of stimulant medication in children with Attention-Deficit/Hyperactivity Disorder (ADHD). Shown below are data for the Connors’ Continuous Performance Test (CPT) for 15 children diagnosed with ADHD. This is a visual vigilance task that requires the child to respond to the computer screen any time they see any letter other than “X”. An overall index is calculated that can be used to indicate attention problems based on reaction time, omission...
In an investigation of pregnancy-induced hypertension, one group of women with this disorder was treated with...
In an investigation of pregnancy-induced hypertension, one group of women with this disorder was treated with low-dose aspirin, and a second group was given a placebo. A sample consisting of 23 women who received aspirin has mean arterial blood pressure 111 mm Hg and standard deviation 8 mm Hg; a sample of 24 women who were given the placebo has mean blood pressure 109mm Hg and standard deviation 8 mm Hg. Suppose that the required assumptions to make inference for...
 Problem Set 2: Research Scenario: In a clinic that focuses on helping victims of domestic minor sex trafficking (DMST), a team of social workers wants to compare the differential effects of treatments for complex trauma. They divide 21 participants into three groups (n = 7 each) that do not differ significantly from one another in terms of pre-treatment trauma symptomology. One group receives Trauma-Focused Cognitive-Behavioral Therapy (TFCBT), one receives Experiential Group Therapy (EGT), and one receives a combination of the...
Most questions answered within 3 hours.
-
A comet orbits the Sun every 8.67 years and reaches its
closest distance to the Sun...
asked 7 minutes ago -
Draw the structure of the compound: 1,1-diethyl-4-
(3,3-dimethylbutyl) cyclohexane.
asked 4 minutes ago -
An inductor with L = 9.70 mH is connected across an ac source
that has voltage...
asked 9 minutes ago -
Karsh has been breeding two different types of angel fish: a
common breed and a rare...
asked 28 minutes ago -
Job postings often state that the successful applicant
must have superior critical thinking and problem-solving skills....
asked 22 minutes ago -
What is the total cost of full ESP Pump equipments (down hole
equipment and upper surface...
asked 21 minutes ago -
cpp
Description
The purpose of this challenge is to use the for loops. This
challenge uses...
asked 29 minutes ago -
1. Drag the statements to the correct type of medium to compare
and contrast different examples...
asked 29 minutes ago -
"Please Solve Problem 2 Please"
Program 1(Total Point 15): You will use scanner class and ask...
asked 31 minutes ago -
If a counting standard has a mean activity of 400 cpm, what is
the probability of...
asked 32 minutes ago -
From the definition of torque in terms of angular momentum, ?
⃗=??/??, show that ??/??=−??/? where...
asked 31 minutes ago -
Please show calculations/work
Marcello is filing as single and has 2018 taxable income of
$730,000 which...
asked 1 hour ago