
Homework Answers

Add Answer to:
Consider the following Excel outout for a regression model where Y = GDP, X, employment and...
please help! Following is a simple linear regression model: y = a + A + &...
 please help!
Following is a simple linear regression model: y = a + A + & The following results were obtained from some statistical software. R2 = 0.523 Syx (regression standard error) = 3.028 n (total observations) = 41 Significance level = 0.05 = 5% Variable Interecpt Slope of X Parameter Estimate 0.519 -0.707 Std. Err. of Parameter Est 0.132 0.239 Note: For all the calculated numbers, keep three decimals. Write the fitted model (5 points) 2. Make a prediction...
please help!
Following is a simple linear regression model: y = a + A + & The following results were obtained from some statistical software. R2 = 0.523 Syx (regression standard error) = 3.028 n (total observations) = 41 Significance level = 0.05 = 5% Variable Interecpt Slope of X Parameter Estimate 0.519 -0.707 Std. Err. of Parameter Est 0.132 0.239 Note: For all the calculated numbers, keep three decimals. Write the fitted model (5 points) 2. Make a prediction...
(Do this problem without using R) Consider the simple linear regression model y =β0 + β1x...
(Do this problem without using R) Consider the simple linear regression model y =β0 + β1x + ε, where the errors are independent and normally distributed, with mean zero and constant variance σ2. Suppose we observe 4 observations x = (1, 1, −1, −1) and y = (5, 3, 4, 0). (a) Fit the simple linear regression model to this data and report the fitted regression line. (b) Carry out a test of hypotheses using α = 0.05 to determine...
#9 need help all of it SUMMARY OUTPUT Regression Statistics Multiple R 0.89079322 R Square Adjusted R S 0.78995244 Standard Erro 3.04000462 Observations 0.79351257 60 ANOVA MS Significance F df Regre...
 #9 need help all of it
SUMMARY OUTPUT Regression Statistics Multiple R 0.89079322 R Square Adjusted R S 0.78995244 Standard Erro 3.04000462 Observations 0.79351257 60 ANOVA MS Significance F df Regression 1 2059.8551 2059.8551222.888768 1.5799E-21 58 536.014429 9.24162808 59 2595.86953 3 Residual Total er 95% Lower 98.0% Upper 98.0% 4.70337792 0.85182782 5.52151244 8.2562E-07 2.99825928 6.40849657 2.66548423 6.74127162 ertising 2.04813433 0.13718744 14.9294597 1.5799E-21 1.77352384 2.32274483 1.7199302 2.37633847 Coefficients Standard Errot Stat P-value Lower 95% Intercept Adv 9. A marketing manager claims...
#9 need help all of it
SUMMARY OUTPUT Regression Statistics Multiple R 0.89079322 R Square Adjusted R S 0.78995244 Standard Erro 3.04000462 Observations 0.79351257 60 ANOVA MS Significance F df Regression 1 2059.8551 2059.8551222.888768 1.5799E-21 58 536.014429 9.24162808 59 2595.86953 3 Residual Total er 95% Lower 98.0% Upper 98.0% 4.70337792 0.85182782 5.52151244 8.2562E-07 2.99825928 6.40849657 2.66548423 6.74127162 ertising 2.04813433 0.13718744 14.9294597 1.5799E-21 1.77352384 2.32274483 1.7199302 2.37633847 Coefficients Standard Errot Stat P-value Lower 95% Intercept Adv 9. A marketing manager claims...
Table 4 Regression Model Y = α X1 + β X2 Parameter
Table 4 Regression Model Y = α X1 + β X2 Parameter Estimates Coefficient Standard Error Constant 12.924 4.425 X1 -3.682 2.630 X2 45.216 12.560 Analysis of Variance Source of Degrees Sum of Mean Variation of Freedom Squares Square F Regression XXX 4,853 2,426.5 XXX Error XXX 485.3 Find above partial statistical output...
Using 17 observations on each variable, a computer program generated the following multiple regression model: ŷ...
 Using 17 observations on each variable, a computer program generated the following multiple regression model: ŷ = 88.2 +7.03x, + 1.69x2 - 9.84x, If the standard errors of the coefficients of the independent variables are, respectively, 4.78, 0.92, and 3.38 can you conclude that the independent variable X, is needed in the regression model? Let B. By, and B, denote the coefficients of the 3 variables in this model, and use a two-sided hypothesis test and significance level of 0.05...
(13 points) Suppose you have a simple linear regression model such that Y; = Bo +...
 (13 points) Suppose you have a simple linear regression model such that Y; = Bo + B18: +€4 with and N(0,0%) Call: 1m (formula - y - x) Formula: F=MSR/MSE, R2 = SSR/SSTO ANOVA decomposition: SSTOSSE + SSR Residuals: Min 1Q Modian -2.16313 -0.64507 -0.06586 Max 30 0.62479 3.00517 Coefficients: Estimate Std. Error t value Pr(> It) (Intercept) 8.00967 0.36529 21.93 -0.62009 0.04245 -14.61 <2e-16 ... <2e-16 .. Signif. codes: ****' 0.001 '** 0.01 '* 0.05 0.1'' 1 Residual standard...
Consider the following ANOVA table for a multiple regression model. Complete parts a through e be...
 *ANSWERS IN BOX ARE INCORRECT*
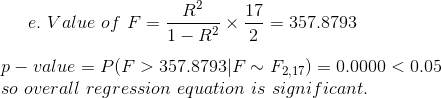
Consider the following ANOVA table for a multiple regression model. Complete parts a through e below. Source Regression 3 3,600 1200 20 Residual 35 2,100 60 Total df SSMSF 38 5,700 a. What is the size of this sample? n41 b. How many independent variables are in this model? c. Calculate the multiple coefficient of determination. R0.5882 Round to four decimal places as needed.) d. Test the significance of the overall regression model using α=0.05...
*ANSWERS IN BOX ARE INCORRECT*
Consider the following ANOVA table for a multiple regression model. Complete parts a through e below. Source Regression 3 3,600 1200 20 Residual 35 2,100 60 Total df SSMSF 38 5,700 a. What is the size of this sample? n41 b. How many independent variables are in this model? c. Calculate the multiple coefficient of determination. R0.5882 Round to four decimal places as needed.) d. Test the significance of the overall regression model using α=0.05...
5. Summary of regression between a dependent variable y and two independent variables X, and x2...
 5. Summary of regression between a dependent variable y and two independent variables X, and x2 is as follows. Please complete the table: SUMMARY OUTPUT Regression Statistics Multiple R 0.9620 R Square R2E? Adjusted R Square 0.9043 Standard Error 12.7096 Observations 10 ANOVA F Significance F F=? Overall p-value=? Regression Residual Total 2 df of SSE MS MSR=? MSE? 14052.1550 1130.7450 SSTE? MSE? 9 Coefficients -18.3683 Standard Error 17.9715 t Stat -1.0221 Intercept ty=? 2.0102 4.7378 0.2471 0.9484 P-value 0.3408...
Consider the model, Y; = Bo + B1 Xi+Uj, where you suspect Xi is endogenous. You...
 Consider the model, Y; = Bo + B1 Xi+Uj, where you suspect Xi is endogenous. You have an exogenous instrument and you estimate the first stage to recover the residuals, Vhatj. You want to test for endogeneity so you estimate the following model using OLS: Y= Bo + B1 Xi + B2 Vhat; + Uj. The estimation results from 100 observations are in the table: Coefficient Standard Errors Constant 2.63 0.98 X 0.97 0.57 Vhat 0.47 0.10 Please select your...
2. Consider the following model: y = XB + u where y is a (nx1) vector...
 2. Consider the following model: y = XB + u where y is a (nx1) vector containing observations on the dependent variable, B = Bi , B X is a (n x 3) matrix. The first column of X is a column of ones whilst the second and third columns contain observations on two explanatory variables (x and x2 respectively). u is (n x 1) vector of error terms. The following are obtained: 1234.7181 1682.376 7345.581 192.0 259.6 1153.1) X'X...
 please help!
Following is a simple linear regression model: y = a + A + & The following results were obtained from some statistical software. R2 = 0.523 Syx (regression standard error) = 3.028 n (total observations) = 41 Significance level = 0.05 = 5% Variable Interecpt Slope of X Parameter Estimate 0.519 -0.707 Std. Err. of Parameter Est 0.132 0.239 Note: For all the calculated numbers, keep three decimals. Write the fitted model (5 points) 2. Make a prediction...
please help!
Following is a simple linear regression model: y = a + A + & The following results were obtained from some statistical software. R2 = 0.523 Syx (regression standard error) = 3.028 n (total observations) = 41 Significance level = 0.05 = 5% Variable Interecpt Slope of X Parameter Estimate 0.519 -0.707 Std. Err. of Parameter Est 0.132 0.239 Note: For all the calculated numbers, keep three decimals. Write the fitted model (5 points) 2. Make a prediction...
 #9 need help all of it
SUMMARY OUTPUT Regression Statistics Multiple R 0.89079322 R Square Adjusted R S 0.78995244 Standard Erro 3.04000462 Observations 0.79351257 60 ANOVA MS Significance F df Regression 1 2059.8551 2059.8551222.888768 1.5799E-21 58 536.014429 9.24162808 59 2595.86953 3 Residual Total er 95% Lower 98.0% Upper 98.0% 4.70337792 0.85182782 5.52151244 8.2562E-07 2.99825928 6.40849657 2.66548423 6.74127162 ertising 2.04813433 0.13718744 14.9294597 1.5799E-21 1.77352384 2.32274483 1.7199302 2.37633847 Coefficients Standard Errot Stat P-value Lower 95% Intercept Adv 9. A marketing manager claims...
#9 need help all of it
SUMMARY OUTPUT Regression Statistics Multiple R 0.89079322 R Square Adjusted R S 0.78995244 Standard Erro 3.04000462 Observations 0.79351257 60 ANOVA MS Significance F df Regression 1 2059.8551 2059.8551222.888768 1.5799E-21 58 536.014429 9.24162808 59 2595.86953 3 Residual Total er 95% Lower 98.0% Upper 98.0% 4.70337792 0.85182782 5.52151244 8.2562E-07 2.99825928 6.40849657 2.66548423 6.74127162 ertising 2.04813433 0.13718744 14.9294597 1.5799E-21 1.77352384 2.32274483 1.7199302 2.37633847 Coefficients Standard Errot Stat P-value Lower 95% Intercept Adv 9. A marketing manager claims...
 Using 17 observations on each variable, a computer program generated the following multiple regression model: ŷ = 88.2 +7.03x, + 1.69x2 - 9.84x, If the standard errors of the coefficients of the independent variables are, respectively, 4.78, 0.92, and 3.38 can you conclude that the independent variable X, is needed in the regression model? Let B. By, and B, denote the coefficients of the 3 variables in this model, and use a two-sided hypothesis test and significance level of 0.05...
 (13 points) Suppose you have a simple linear regression model such that Y; = Bo + B18: +€4 with and N(0,0%) Call: 1m (formula - y - x) Formula: F=MSR/MSE, R2 = SSR/SSTO ANOVA decomposition: SSTOSSE + SSR Residuals: Min 1Q Modian -2.16313 -0.64507 -0.06586 Max 30 0.62479 3.00517 Coefficients: Estimate Std. Error t value Pr(> It) (Intercept) 8.00967 0.36529 21.93 -0.62009 0.04245 -14.61 <2e-16 ... <2e-16 .. Signif. codes: ****' 0.001 '** 0.01 '* 0.05 0.1'' 1 Residual standard...
 *ANSWERS IN BOX ARE INCORRECT*
Consider the following ANOVA table for a multiple regression model. Complete parts a through e below. Source Regression 3 3,600 1200 20 Residual 35 2,100 60 Total df SSMSF 38 5,700 a. What is the size of this sample? n41 b. How many independent variables are in this model? c. Calculate the multiple coefficient of determination. R0.5882 Round to four decimal places as needed.) d. Test the significance of the overall regression model using α=0.05...
*ANSWERS IN BOX ARE INCORRECT*
Consider the following ANOVA table for a multiple regression model. Complete parts a through e below. Source Regression 3 3,600 1200 20 Residual 35 2,100 60 Total df SSMSF 38 5,700 a. What is the size of this sample? n41 b. How many independent variables are in this model? c. Calculate the multiple coefficient of determination. R0.5882 Round to four decimal places as needed.) d. Test the significance of the overall regression model using α=0.05...
 5. Summary of regression between a dependent variable y and two independent variables X, and x2 is as follows. Please complete the table: SUMMARY OUTPUT Regression Statistics Multiple R 0.9620 R Square R2E? Adjusted R Square 0.9043 Standard Error 12.7096 Observations 10 ANOVA F Significance F F=? Overall p-value=? Regression Residual Total 2 df of SSE MS MSR=? MSE? 14052.1550 1130.7450 SSTE? MSE? 9 Coefficients -18.3683 Standard Error 17.9715 t Stat -1.0221 Intercept ty=? 2.0102 4.7378 0.2471 0.9484 P-value 0.3408...
 Consider the model, Y; = Bo + B1 Xi+Uj, where you suspect Xi is endogenous. You have an exogenous instrument and you estimate the first stage to recover the residuals, Vhatj. You want to test for endogeneity so you estimate the following model using OLS: Y= Bo + B1 Xi + B2 Vhat; + Uj. The estimation results from 100 observations are in the table: Coefficient Standard Errors Constant 2.63 0.98 X 0.97 0.57 Vhat 0.47 0.10 Please select your...
 2. Consider the following model: y = XB + u where y is a (nx1) vector containing observations on the dependent variable, B = Bi , B X is a (n x 3) matrix. The first column of X is a column of ones whilst the second and third columns contain observations on two explanatory variables (x and x2 respectively). u is (n x 1) vector of error terms. The following are obtained: 1234.7181 1682.376 7345.581 192.0 259.6 1153.1) X'X...
Most questions answered within 3 hours.
-
A χ2-curve, looking at the relationship between age and hours
spent working at an office per...
asked 1 minute from now -
The pH of a sample of water from a river is 5.0. A
sample of effluent from...
asked 43 minutes ago -
At the beginning of the period, the Fabricating Department
budgeted direct labor of $136,500 and equipment...
asked 1 hour ago -
Please answer all
____ 28. Rent control is usually
justified on the grounds that it protects...
asked 1 hour ago -
PARTS A-D HAVE BEEN ANSWERED. WAS TOLD TO REPOST. ONLY ANSWER
PARTS E and F.
A...
asked 1 hour ago -
2) You are given the task of finding a representation for a
circle in a drawing...
asked 2 hours ago -
STUDY QUESTION: Does use of diet drug fen-phen
(fenfluramine-phentermine) cause valvular heart disease?
HINT: Valvular heart...
asked 2 hours ago -
1. An object weighing 40 N rests on a surface. The coefficient
of friction is 0.35....
asked 3 hours ago -
Investor company owns 35% of investee company voting stock and
accounts for the investment under the...
asked 4 hours ago -
The number of major faults on a randomly chosen 1 km stretch of
highway has a...
asked 5 hours ago -
Consider the competitive environment of Starbuck's, Progressive
Insurance, a manufacturing firm with low turnover, or a...
asked 5 hours ago -
3. Gains from trade
Consider two neighbouring island countries called Euphoria and
Contente. They each have...
asked 7 hours ago