The Student Government Association at Middle Carolina
University
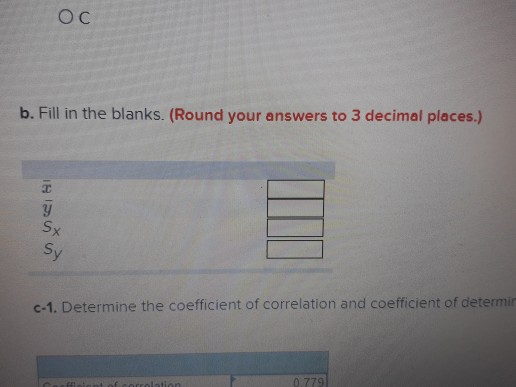
wanted to demonstrate the relationship between the number of beers
a
student drinks and his or her blood alcohol content (BAC). A
random
sample of 18 students participated in a study in which each
participating student was randomly assigned a number of 12-ounce
cans
of beer to drink. Thirty minutes after they consumed their
assigned
number of beers, a member of the local sheriff’s office measured
their
blood alcohol content. The sample information is reported
below.

please help
Homework Answers
X: Beers, Y: BAC
Using Excel functions:
x̅ = AVERAGE(Beers) = 4.278
y̅ = AVERAGE(BAC) = 0.079
Sx = STDEV.S(Beers) = 2.137
Sy = STDEV.S(BAC) = 0.027
Coefficient of correlation: r = CORREL(Beers,BAC) = 0.779
Coefficient of determination = r2 = 0.779*0.779 = 0.607
Add Answer to:
The Student Government Association at Middle Carolina
University
wanted to demonstrate the relationship between the number...
The student government association wanted to demonstrate the relationship between the # of beers (“beers”) a...
The student government association wanted to demonstrate the relationship between the # of beers (“beers”) a student drinks and their blood alcohol content (“BAC”). A random sample of students participated in a study, and the data below was obtained. Use alpha = .05 for statistical tests. Given the following two regression output tables, answer the questions: ANOVA df SS MS F Significance F Regression 1 0.002811 0.002811 10.11611 0.015478078 Residual 7 0.001945 0.000278 Total 8 0.004756 Coefficients Standard Error t...
Section 2: (50%) Round your answer to 2 decimal places LA University reported the number of...
 Section 2: (50%) Round your answer to 2 decimal places LA University reported the number of beers a student drinks and his or her blood alcohol content (BAC). A random sample of 10 students participated in a study. The sample information is reported below. Student Beers BAC BAC Student Beers Charles 0.10 Jaime 0.07 9. 3. Ellis 0.05 Shannon 60'0 3. Harriet 0.08 60'0 0.10 Nellie Marlene Jeanne 0.04 4. Tara 0.10 Mike 4 0.07 What are the best estimate...
PLEASE ANSWER EACH PART CLEARLY STATE THE ANSWERS AND PLEASE MAKE SURE THE FORMAT USED CAN...
PLEASE ANSWER EACH PART CLEARLY STATE THE ANSWERS AND PLEASE MAKE SURE THE FORMAT USED CAN BE COPIED AND PASTED. Use the tools of Excel to analyze the following: Blood Alcohol Content (BAC) was evaluated based on number of beers consumed over 19 subjects. i) what is your dependent variable? ii) what is your independent variable? a) Develop the correlation coefficient b) Is this correlation coefficient significant? Use the six steps of hypothesis testing. c) Develop the Regression Equation using...
Sixteen student volunteers at Ohio State University drank a randomly assigned number of cans of beer....
 Sixteen student volunteers at Ohio State University drank a randomly assigned number of cans of beer.
Thirty minutes later, a police officer measured their blood alcohol content (BAC) in grams of alcohol per deciliter of blood.
Given is a scatterplot displaying the relationship between BAC and number of cans of beer as well as the linear model for predicting BAC.
If the student who drank the most number of beers (9 beers) actually had a BAC of 0.15 grams/deciliter, how...
Sixteen student volunteers at Ohio State University drank a randomly assigned number of cans of beer.
Thirty minutes later, a police officer measured their blood alcohol content (BAC) in grams of alcohol per deciliter of blood.
Given is a scatterplot displaying the relationship between BAC and number of cans of beer as well as the linear model for predicting BAC.
If the student who drank the most number of beers (9 beers) actually had a BAC of 0.15 grams/deciliter, how...
Use the following to answer Questions 12-13: How well does the number of beers a student...
Use the following to answer Questions 12-13: How well does the number of beers a student drinks predict his or her blood alcohol content? Sixteen student volunteers at The Ohio State University drank a randomly assigned number of cans of beer. Thirty minutes later, a police officer measured their blood alcohol content (BAC). A scatterplot of the data appears below: The scatterplot above shows
2) Many people believe that gender, weight, drinking habits, and many other factors are much more...
 2) Many people believe that gender, weight, drinking habits, and many other factors are much more important in predicting blood alcohol content (BAC) than simply considering the number of drinks a person consumed. Here we examine data from sixteen student volunteers at Ohio State University who each drank a randomly assigned number of cans of beer. These students were evenly divided between men and women, and they differed in weight and drinking habits. Thirty minutes later, a police officer measured...
How much alcohol can one consume before one's Blood Alcohol Content (BAC) is above the legal limit? An experiment was conducted at Gallaudet University to predict Blood Alcohol Content fr...
 How much alcohol can one consume before one's Blood Alcohol Content (BAC) is above the legal limit? An experiment was conducted at Gallaudet University to predict Blood Alcohol Content from the number of beers. A total of 50 volunteer college students (some men and some women) were assigned a certain number of beers to drink and then, after a half an hour, their Blood Alcohol (BAC) level was measured. To make this assignment simpler, we will only use the first...
Stock A and B have the following returns: (Show your calculations) Number 1 2 3 4...
Stock A and B have the following returns: (Show your calculations) Number 1 2 3 4 5 6 7 8 Stock A 0.10 0.17 0.05 -0.05 -0.08 0.09 0.10 0.14 Stock B -0.03 0.10 0.05 0.15 0.12 -0.05 0.07 0.05 a- What are the expected returns of the two stocks? b- What are the standard deviations of the two stocks? c- If their correlation is -0.49, what is the expected return and standard deviation of a portfolio of 35% stock...
How much alcohol can one consume before one's Blood Alcohol Content (BAC) is above the legal...
 How much alcohol can one consume before one's Blood Alcohol Content (BAC) is above the legal limit? An experiment was conducted at Gallaudet University to predict Blood Alcohol Content from the number of beers. A total of 50 volunteer college students (some men and some women) were assigned a certain number of beers to drink and then, after a half an hour, their Blood Alcohol (BAC) level was measured. To make this assignment simpler, we will only use the first...
Joaquin wanted to know if there was an association between the number of books a student...
 Joaquin wanted to know if there was an association between the
number of books a student reads during the summer and that
student’s attitude toward college. Joaquin asked 10 students who
were becoming sophomore how many book they read during the summer
and to complete a survey that yielded a higher score the more they
liked college.
Question: Compute the effect size. A.
.604 B.
.790 C.
.361 D.
.308
Number of Books Read During Summer Attitude Toward College 0...
Joaquin wanted to know if there was an association between the
number of books a student reads during the summer and that
student’s attitude toward college. Joaquin asked 10 students who
were becoming sophomore how many book they read during the summer
and to complete a survey that yielded a higher score the more they
liked college.
Question: Compute the effect size. A.
.604 B.
.790 C.
.361 D.
.308
Number of Books Read During Summer Attitude Toward College 0...
 Section 2: (50%) Round your answer to 2 decimal places LA University reported the number of beers a student drinks and his or her blood alcohol content (BAC). A random sample of 10 students participated in a study. The sample information is reported below. Student Beers BAC BAC Student Beers Charles 0.10 Jaime 0.07 9. 3. Ellis 0.05 Shannon 60'0 3. Harriet 0.08 60'0 0.10 Nellie Marlene Jeanne 0.04 4. Tara 0.10 Mike 4 0.07 What are the best estimate...
 Sixteen student volunteers at Ohio State University drank a randomly assigned number of cans of beer.
Thirty minutes later, a police officer measured their blood alcohol content (BAC) in grams of alcohol per deciliter of blood.
Given is a scatterplot displaying the relationship between BAC and number of cans of beer as well as the linear model for predicting BAC.
If the student who drank the most number of beers (9 beers) actually had a BAC of 0.15 grams/deciliter, how...
Sixteen student volunteers at Ohio State University drank a randomly assigned number of cans of beer.
Thirty minutes later, a police officer measured their blood alcohol content (BAC) in grams of alcohol per deciliter of blood.
Given is a scatterplot displaying the relationship between BAC and number of cans of beer as well as the linear model for predicting BAC.
If the student who drank the most number of beers (9 beers) actually had a BAC of 0.15 grams/deciliter, how...
 2) Many people believe that gender, weight, drinking habits, and many other factors are much more important in predicting blood alcohol content (BAC) than simply considering the number of drinks a person consumed. Here we examine data from sixteen student volunteers at Ohio State University who each drank a randomly assigned number of cans of beer. These students were evenly divided between men and women, and they differed in weight and drinking habits. Thirty minutes later, a police officer measured...
 How much alcohol can one consume before one's Blood Alcohol Content (BAC) is above the legal limit? An experiment was conducted at Gallaudet University to predict Blood Alcohol Content from the number of beers. A total of 50 volunteer college students (some men and some women) were assigned a certain number of beers to drink and then, after a half an hour, their Blood Alcohol (BAC) level was measured. To make this assignment simpler, we will only use the first...
 How much alcohol can one consume before one's Blood Alcohol Content (BAC) is above the legal limit? An experiment was conducted at Gallaudet University to predict Blood Alcohol Content from the number of beers. A total of 50 volunteer college students (some men and some women) were assigned a certain number of beers to drink and then, after a half an hour, their Blood Alcohol (BAC) level was measured. To make this assignment simpler, we will only use the first...
 Joaquin wanted to know if there was an association between the
number of books a student reads during the summer and that
student’s attitude toward college. Joaquin asked 10 students who
were becoming sophomore how many book they read during the summer
and to complete a survey that yielded a higher score the more they
liked college.
Question: Compute the effect size. A.
.604 B.
.790 C.
.361 D.
.308
Number of Books Read During Summer Attitude Toward College 0...
Joaquin wanted to know if there was an association between the
number of books a student reads during the summer and that
student’s attitude toward college. Joaquin asked 10 students who
were becoming sophomore how many book they read during the summer
and to complete a survey that yielded a higher score the more they
liked college.
Question: Compute the effect size. A.
.604 B.
.790 C.
.361 D.
.308
Number of Books Read During Summer Attitude Toward College 0...
Most questions answered within 3 hours.
-
Please help me with FLOWCHART and UML diagram for class,
thank you!
#include <iostream>
#include <fstream>...
asked 13 minutes ago -
3. Describe the “logic circuit” of the Lac operon. Which
proteins are bound or not to...
asked 14 minutes ago -
Ayesha’s adjusted gross income is $60,000 in 2019. She donated a
piece of artwork with a...
asked 21 minutes ago -
For Dijkstra’s shortest path algorithm:
a. Give the Big-O time for Dijkstra’s shortest path algorithm
and...
asked 33 minutes ago -
Phosphorus violates the 'octet rule' in biological molecules,
forming more covalent bonds than expected based on...
asked 36 minutes ago -
A 1.3 eV electron has a 10-4 probability of tunneling
through a 2.4 eV potential barrier....
asked 55 minutes ago -
What is the one ingredient that is common to being successful
with all stakeholders?
profit
trust...
asked 54 minutes ago -
Write an assembly language 32 bit program that reads in lines of
text by a .txt...
asked 56 minutes ago -
what is the density ( in g/L) of hydrogen gas at 29 degrees C and a...
asked 1 hour ago -
5-6. You are considering three investment alternatives for some
spare cash: Old Reliable Corporation stock (A1),...
asked 57 minutes ago -
Problem 16-02
Receivables Investment
Medwig Corporation has a DSO of 45 days. The company averages
$7,250...
asked 1 hour ago -
Mr. Brown hired Lowe's Maintenance Services Limited to repair
and paint the exterior wall of his...
asked 1 hour ago