It is reported in USA Today that the average flight cost nationwide is $484.314. You have...
It is reported in USA Today that the average flight cost nationwide is $484.314. You have never paid close to that amount and you want to perform a hypothesis test that the true average is actually greater than $484.314. The hypotheses for this situation are as follows: Null Hypothesis: μ ≤ 484.314, Alternative Hypothesis: μ > 484.314. A random sample of 34 flights shows an average cost of $489.228 with a standard deviation of $53.5284. What is the test statistic and p-value for this test?
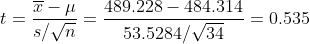
1) Test Statistic: 0.535, P-Value: 0.298
2) Test Statistic: -0.535, P-Value: 0.702
3) Test Statistic: -0.535, P-Value: 0.298
4) Test Statistic: 0.535, P-Value: 0.596
5) Test Statistic: 0.535, P-Value: 0.702
It is reported in USA Today that the average flight cost nationwide is $353.57. You have never paid close to that amount and you want to perform a hypothesis test that the true average is actually less than $353.57. The hypotheses for this situation are as follows: Null Hypothesis: μ ≥ 353.57, Alternative Hypothesis: μ < 353.57. You take a random sample of national flight cost information and perform a one sample mean hypothesis test. You observe a p-value of 0.8469. What is the appropriate conclusion? Conclude at the 5% level of significance.
1) The true average flight cost is significantly less than $353.57.
2) We did not find enough evidence to say the true average flight cost is greater than $353.57.
3) We did not find enough evidence to say a significant difference exists between the true average flight cost and $353.57.
4) The true average flight cost is greater than or equal to $353.57.
5) We did not find enough evidence to say the true average flight cost is less than $353.57.
Homework Answers
Q 1) The test statistic is
The P-Value is .298
Answer: 1) Test Statistic: 0.535, P-Value: 0.298
Q 2) Since p value > significance level. we fail to reject H0.
Answer: 5) We did not find enough evidence to say the true average flight cost is less than $353.57.
Add Answer to:
It is reported in USA Today that the average flight cost
nationwide is $484.314. You have...
It is reported in USA Today that the average flight cost nationwide is $458.78. You have...
It is reported in USA Today that the average flight cost nationwide is $458.78. You have never paid close to that amount and you want to perform a hypothesis test that the true average is actually less than $458.78. The hypotheses for this situation are as follows: Null Hypothesis: μ ≥ 458.78, Alternative Hypothesis: μ < 458.78. You take a random sample of national flight cost information and perform a one sample mean hypothesis test. You observe a p-value of...
It is reported in USA Today that the average flight cost nationwide is $507.93. You have...
It is reported in USA Today that the average flight cost nationwide is $507.93. You have never paid close to that amount and you want to perform a hypothesis test that the true average is actually greater than $507.93. The hypotheses for this situation are as follows: Null Hypothesis: μ ≤ 507.93, Alternative Hypothesis: μ > 507.93. A random sample of 27 flights shows an average cost of $501.435 with a standard deviation of $60.2994. What is the test statistic...
It is reported in USA Today that the average flight cost nationwide is $448.4. You have...
It is reported in USA Today that the average flight cost nationwide is $448.4. You have never paid close to that amount and you want to perform a hypothesis test that the true average is actually greater than $448.4. The hypotheses for this situation are as follows: Null Hypothesis: μ ≤ 448.4, Alternative Hypothesis: μ > 448.4. If the true average flight cost nationwide is $352.63 and the null hypothesis is rejected, did a type I, type II, or no...
Question 12 (1 point) It is reported in USA Today that the average flight cost nationwide is $380.51. You have nev...
 Question 12 (1 point) It is reported in USA Today that the average flight cost nationwide is $380.51. You have never paid close to that amount and you want to perform a hypothesis test that the true average is actually different from $380.51. The hypotheses for this situation are as follows: Null Hypothesis: u = 380.51, Alternative Hypothesis: u 380.51. You take a random sample of national flight cost information and perform a one sample mean hypothesis test. You observe...
It is reported in USA Today that the average flight cost nationwide is $368.88. You have...
It is reported in USA Today that the average flight cost nationwide is $368.88. You have never paid close to that amount and you want to perform a hypothesis test that the true average is actually less than $368.88. What are the appropriate hypotheses for this test? Question 8 options: 1) HO: μ ≤ 368.88 HA: μ > 368.88 2) HO: μ ≥ 368.88 HA: μ < 368.88 3) HO: μ = 368.88 HA: μ ≠ 368.88 4) HO: μ...
Question 17 (1 point) It is reported in USA Today that the average flight cost nationwide...
 Question 17 (1 point) It is reported in USA Today that the average flight cost nationwide is $472.49. You have never paid close to that amount and you want to perform a hypothesis test that the true average is actually less than $472.49. The hypotheses for this situation are as follows: Null Hypothesis: u 2 472.49, Alternative Hypothesis: u < 472.49. If the true average flight cost nationwide is $589.77 and the null hypothesis is rejected, did a type I,...
Question 15 (1 point) Your friend tells you that the proportion of active Major League Baseball...
Question 15 (1 point) Your friend tells you that the proportion of active Major League Baseball players who have a batting average greater than .300 is different from 0.72, a claim you would like to test. The hypotheses here are Null Hypothesis: p = 0.72, Alternative Hypothesis: p ≠ 0.72. If you take a random sample of players and calculate p-value for your hypothesis test of 0.2296, what is the appropriate conclusion? Conclude at the 5% level of significance. Question...
Question 12 (1 point) Consumers Energy states that the average electric bill across the state is $108.57. You want to te...
Question 12 (1 point) Consumers Energy states that the average electric bill across the state is $108.57. You want to test the claim that the average bill amount is actually greater than $108.57. The hypotheses for this situation are as follows: Null Hypothesis: μ ≤ 108.57, Alternative Hypothesis: μ > 108.57. You complete a randomized survey throughout the state and perform a one-sample hypothesis test for the mean, which results in a p-value of 0.6273. What is the appropriate conclusion?...
A USA Today article claims that the proportion of people who believe global warming is a...
A USA Today article claims that the proportion of people who believe global warming is a serious issue is 0.73, but given the number of people you've talked to about this same issue, you believe it is different from 0.73. The hypotheses for this test are Null Hypothesis: p = 0.73, Alternative Hypothesis: p ≠ 0.73. If you randomly sample 21 people and 12 of them believe that global warming is a serious issue, what is your test statistic and...
sorry that there is three- I am having a hard time understanding these ones. It is believed that students who begi...
 sorry that there is three- I am having a hard time
understanding these ones.
It is believed that students who begin studying for final exams a week before the test score differently than students who wait until the night before. Suppose you want to test the hypothesis that students who study one week before score different from students who study the night before. A hypothesis test for two independent samples is run based on your data and a p-value is...
sorry that there is three- I am having a hard time
understanding these ones.
It is believed that students who begin studying for final exams a week before the test score differently than students who wait until the night before. Suppose you want to test the hypothesis that students who study one week before score different from students who study the night before. A hypothesis test for two independent samples is run based on your data and a p-value is...
 Question 12 (1 point) It is reported in USA Today that the average flight cost nationwide is $380.51. You have never paid close to that amount and you want to perform a hypothesis test that the true average is actually different from $380.51. The hypotheses for this situation are as follows: Null Hypothesis: u = 380.51, Alternative Hypothesis: u 380.51. You take a random sample of national flight cost information and perform a one sample mean hypothesis test. You observe...
 Question 17 (1 point) It is reported in USA Today that the average flight cost nationwide is $472.49. You have never paid close to that amount and you want to perform a hypothesis test that the true average is actually less than $472.49. The hypotheses for this situation are as follows: Null Hypothesis: u 2 472.49, Alternative Hypothesis: u < 472.49. If the true average flight cost nationwide is $589.77 and the null hypothesis is rejected, did a type I,...
 sorry that there is three- I am having a hard time
understanding these ones.
It is believed that students who begin studying for final exams a week before the test score differently than students who wait until the night before. Suppose you want to test the hypothesis that students who study one week before score different from students who study the night before. A hypothesis test for two independent samples is run based on your data and a p-value is...
sorry that there is three- I am having a hard time
understanding these ones.
It is believed that students who begin studying for final exams a week before the test score differently than students who wait until the night before. Suppose you want to test the hypothesis that students who study one week before score different from students who study the night before. A hypothesis test for two independent samples is run based on your data and a p-value is...
Most questions answered within 3 hours.
-
What specific indicators can point to lack of progress for
African Americans in American society?
asked 42 minutes ago -
1-The Electrons in a beam are moving at 2.7×10⁸ m/s in an
electric field of 15000...
asked 58 minutes ago -
A gas tank is a vertical cylinder. It has a radius of 1m, a
height of...
asked 1 hour ago -
Accent Software faces the following conditions. All of these
support Accent’s use of a market-penetration pricing...
asked 2 hours ago -
A mathematically inclined friend emails you the following
instructions: "Meet me in the cafeteria the first...
asked 2 hours ago -
A monopoly sells in two countries . The demand curves in the two
countries are p1...
asked 3 hours ago -
A .15kg rubber ball is bounced off a wall. Before hitting the
wall, the ball moves...
asked 4 hours ago -
A manufacturing company preparing to build a new plant is
considering three potential locations for it....
asked 4 hours ago -
B. If compound Y has approximately the same values of solubility
in toluene as compound X,...
asked 4 hours ago -
Oscar Inc. has inventory in Japan valued at 39,051,000 Yen one
year ago. One year ago...
asked 4 hours ago -
If Canada suffered from "fundamental disequilibrium," and its
government choose not to devalue its currency, a...
asked 5 hours ago -
4. How many input & output Key Value Pairs are passed into,
and emitted out of...
asked 5 hours ago