
Homework Answers
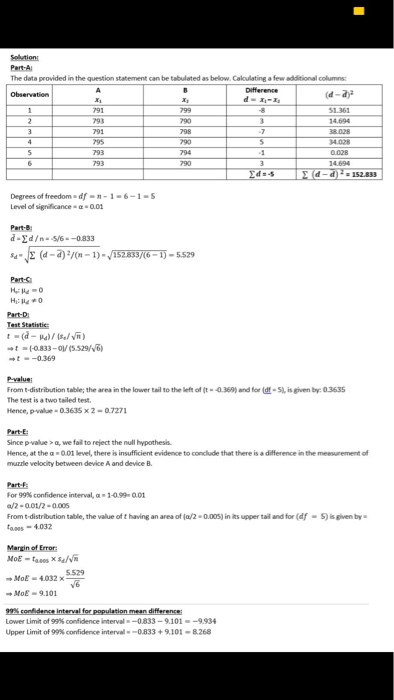
In part D) the value 0.3635 comes from t distribution table. Now a t-table shows the probabilities(areas) under the probability density function of the t distribution for different degrees of freedom.
Here the test statistic is t= -0.369. So P[T<=t]=0.3635 from t-table (this is a inbuilt table) some table only shows positive value of t then we take the value 0.369 ,based on symmetry the area above 0.369 is equals to area under-0.369.
so,we look across the row for df=5 for values near 0.369.
Similarly in part F) using a t-table for df =5 we can get the critical value for t5,0.005 which is 4.032.
Add Answer to:
I just need to know how they got .3635 in D.) and how they got
4.032...
I ONLY NEED PART D to be answered . The rest is solved already,I just...
I ONLY NEED PART D to be answered . The rest is solved already, I just forgot to add part D on the lastThe quality control manager at a light bulb factory needs to estimate the mean life of a large shipment of light bulbs. The standard deviation is 96 hours. A random sample of 64 light bulbs indicated a sample mean life of 300 hours. Complete parts (a) through (d) below.a. Construct a 99% confidence interval estimate for the...
Teacher gave us the answers which i included, but i need to know how to work...
 Teacher gave us the answers which i included, but i need to know
how to work the problems for the test! I promise to rate the
answer!
Paired Samples Statistics Std. Error Mean Results for husbands' satisfaction Mean Std. Deviation 4.33 4.83 Pair h sat t 31.78 30.28 76 76 50 h sat t2 t1- time 1 t2time 2 Paired Samples Correlations Si Correlation 68 Pair 1 h sat t1 & h sat t2 76 Paired Samples Test Paired Diffe...
Teacher gave us the answers which i included, but i need to know
how to work the problems for the test! I promise to rate the
answer!
Paired Samples Statistics Std. Error Mean Results for husbands' satisfaction Mean Std. Deviation 4.33 4.83 Pair h sat t 31.78 30.28 76 76 50 h sat t2 t1- time 1 t2time 2 Paired Samples Correlations Si Correlation 68 Pair 1 h sat t1 & h sat t2 76 Paired Samples Test Paired Diffe...
I have the correct answers for 6-11 but I need help with the multiple choice so...
 I
have the correct answers for 6-11 but I need help with the multiple
choice so help me determine whether it is true or false please. I
need 12-15.
JULIULIUL. JICOP pica Researchers recently investigated sleep-related breathing disorders in adults with traumatic brain injuries (TBI). The respiratory disturbance Index (RDI) represents the number of apneic and hypopnele episodes (snoring, gurgling, air passage obstruction, etc.) per hour of sleep and was used by scientists to measure the severity of a patient's...
I
have the correct answers for 6-11 but I need help with the multiple
choice so help me determine whether it is true or false please. I
need 12-15.
JULIULIUL. JICOP pica Researchers recently investigated sleep-related breathing disorders in adults with traumatic brain injuries (TBI). The respiratory disturbance Index (RDI) represents the number of apneic and hypopnele episodes (snoring, gurgling, air passage obstruction, etc.) per hour of sleep and was used by scientists to measure the severity of a patient's...
(a) Is there a difference in the measurement of the muzzle velocity between device A and...
 (a) Is there a difference
in the measurement of the muzzle velocity between device A and
device B at the α = 0.01 level of significance? Note: A normal
probability plot and boxplot of the data indicate that the
differences are approximately normally distributed with no
outliers. Let di = Ai − Bi.
(i) Identify the null and alternative
hypotheses.
(ii) Determine the test statistic for
this hypothesis test (t0 = ?). Round to two
decimal places as needed.
(iii)...
(a) Is there a difference
in the measurement of the muzzle velocity between device A and
device B at the α = 0.01 level of significance? Note: A normal
probability plot and boxplot of the data indicate that the
differences are approximately normally distributed with no
outliers. Let di = Ai − Bi.
(i) Identify the null and alternative
hypotheses.
(ii) Determine the test statistic for
this hypothesis test (t0 = ?). Round to two
decimal places as needed.
(iii)...
 Teacher gave us the answers which i included, but i need to know
how to work the problems for the test! I promise to rate the
answer!
Paired Samples Statistics Std. Error Mean Results for husbands' satisfaction Mean Std. Deviation 4.33 4.83 Pair h sat t 31.78 30.28 76 76 50 h sat t2 t1- time 1 t2time 2 Paired Samples Correlations Si Correlation 68 Pair 1 h sat t1 & h sat t2 76 Paired Samples Test Paired Diffe...
Teacher gave us the answers which i included, but i need to know
how to work the problems for the test! I promise to rate the
answer!
Paired Samples Statistics Std. Error Mean Results for husbands' satisfaction Mean Std. Deviation 4.33 4.83 Pair h sat t 31.78 30.28 76 76 50 h sat t2 t1- time 1 t2time 2 Paired Samples Correlations Si Correlation 68 Pair 1 h sat t1 & h sat t2 76 Paired Samples Test Paired Diffe...
 I
have the correct answers for 6-11 but I need help with the multiple
choice so help me determine whether it is true or false please. I
need 12-15.
JULIULIUL. JICOP pica Researchers recently investigated sleep-related breathing disorders in adults with traumatic brain injuries (TBI). The respiratory disturbance Index (RDI) represents the number of apneic and hypopnele episodes (snoring, gurgling, air passage obstruction, etc.) per hour of sleep and was used by scientists to measure the severity of a patient's...
I
have the correct answers for 6-11 but I need help with the multiple
choice so help me determine whether it is true or false please. I
need 12-15.
JULIULIUL. JICOP pica Researchers recently investigated sleep-related breathing disorders in adults with traumatic brain injuries (TBI). The respiratory disturbance Index (RDI) represents the number of apneic and hypopnele episodes (snoring, gurgling, air passage obstruction, etc.) per hour of sleep and was used by scientists to measure the severity of a patient's...
 (a) Is there a difference
in the measurement of the muzzle velocity between device A and
device B at the α = 0.01 level of significance? Note: A normal
probability plot and boxplot of the data indicate that the
differences are approximately normally distributed with no
outliers. Let di = Ai − Bi.
(i) Identify the null and alternative
hypotheses.
(ii) Determine the test statistic for
this hypothesis test (t0 = ?). Round to two
decimal places as needed.
(iii)...
(a) Is there a difference
in the measurement of the muzzle velocity between device A and
device B at the α = 0.01 level of significance? Note: A normal
probability plot and boxplot of the data indicate that the
differences are approximately normally distributed with no
outliers. Let di = Ai − Bi.
(i) Identify the null and alternative
hypotheses.
(ii) Determine the test statistic for
this hypothesis test (t0 = ?). Round to two
decimal places as needed.
(iii)...
Most questions answered within 3 hours.
-
An explosion breaks a 20.0-kg object into three parts. The
object is initially moving at a...
asked 26 minutes ago -
Calculate the approximate number of residues of Rubisco, which
is involved in carbon fixation in plants,...
asked 1 hour ago -
Other decisions about scientific claims can have a much broader
impact.ENERGYarrow-10x10.png, environment, health, security - all...
asked 2 hours ago -
I need to write a research paper and work cited about this
topic: The United States...
asked 2 hours ago -
Hello! I was wondering if I could have some help?
If the vapor pressure of carvone...
asked 3 hours ago -
An economist wants to estimate the mean per capita income (in
thousands of dollars) for a...
asked 3 hours ago -
What would be the input/output characteristic of a circuit
obtained by putting two of your 2's-complementers...
asked 3 hours ago -
In Drosophila, the transition from the syncytial blastoderm
stage to the cellular blastoderm stage is a...
asked 3 hours ago -
Project management question:
Name 3 different types of resources (hint: humans are one
type)
asked 4 hours ago -
Consider the following reaction: C 2H 2( g) + 2H 2( g) C 2H 6(
g)...
asked 4 hours ago -
Consider a 1.0 L buffer containing 0.092 mol L-1 HCOOH and 0.100
mol L-1 HCOO-. What...
asked 4 hours ago -
Koch Realty has owned a vacant land with a FMV of
$775,000 and an adjusted basis...
asked 4 hours ago