A set of final examination grades
Homework Answers
Request Answer!
We need at least 10 more requests to produce the answer.
0 / 10 have requested this problem solution
The more requests, the faster the answer.
A set of final examination grades in a calculus course wasfound to be normally distributed with...
A set of final examination grades in a calculus course wasfound to be normally distributed with a mean of 69 and a standarddeviation of 9. a. what is the probality of getting a grade of 91or less on this exam? b. What percentage of students scored between 65 and89? c. What percentage of students scored between 81 and89? d. Only 5% of the students taking the test scored higherthan what grade?
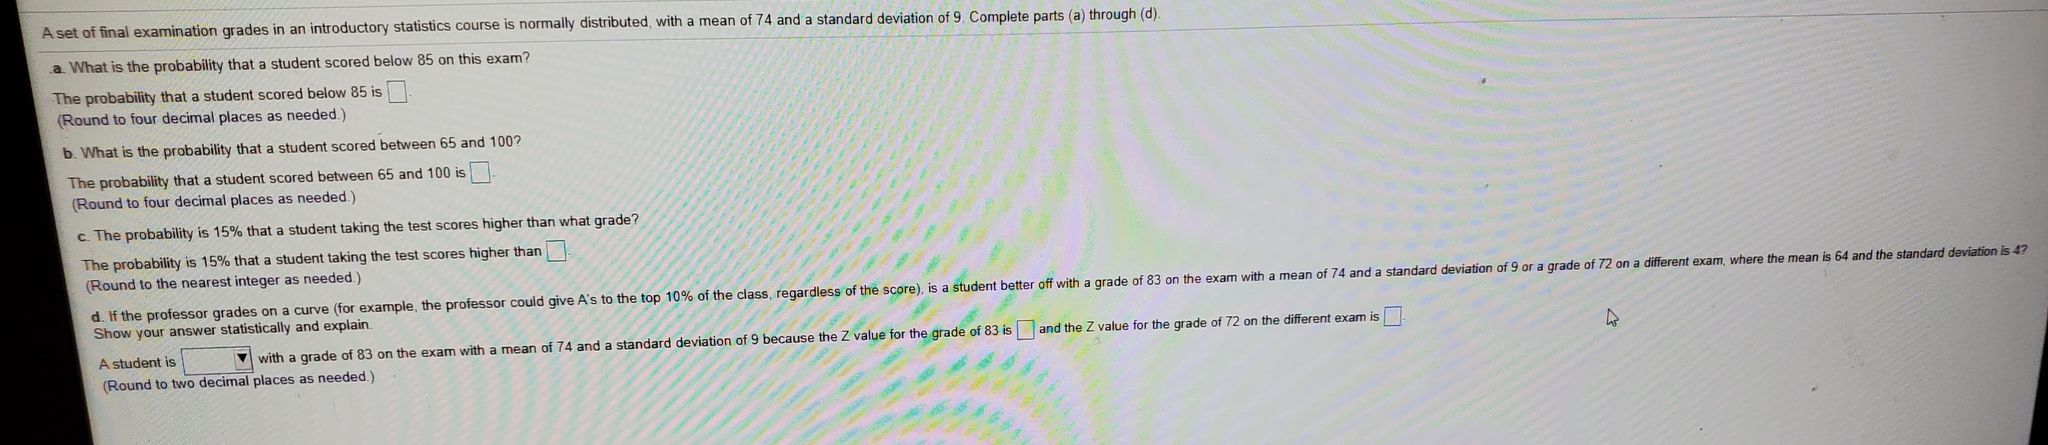
A set of final examination grades in an introductory statistics course is normally distributed, with a...
A set of final examination grades in an introductory statistics course is normally distributed, with a mean of 75 and a standard deviation of 8. Complete parts (a) through (d). a. What is the probability that a student scored below 88 on this exam? The probability that a student scored below 88 is 0.94790.9479. (Round to four decimal places as needed.) b. What is the probability that a student scored between 67 and 94? The probability that a student scored...
A set of final examination grades in an introductory statistics course is normally distributed, with a...
A set of final examination grades in an introductory statistics course is normally distributed, with a mean of 73 and a standard deviation of 7. Complete parts (a) through (d). a. What is the probability that a student scored below 86 on this exam? (Round to four decimal places as needed.) b. What is the probability that a student scored between 66 and 93? (Round to four decimal places as needed.) c. The probability is 55% that a student taking...
A set of final examination grades in a calculus course was found to be normally distributed...
A set of final examination grades in a calculus course was found to be normally distributed with a mean of 69 and a standard deviation of 8. Only 5% of the students taking the test scored higher than what grade? (Ch 6) answer is 83.81 but please show and explain how, what z table you used and the numbers. thanks
A set of final examination grades in an introductory statistics course is normally distributed, with a...
A set of final examination grades in an introductory statistics course is normally distributed, with a mean of 78 and a standard deviation of 8. What is the probability that a student scored between 70 and 99? The probability that a student scored between 70 and 99 is =?
A set of final examination grades ina STAT course was found to be normally distributed with a mean of 72 and standard deviation of 8

The following scores represent the final examination grades for an elementary statistics course:
The following scores represent the final examination grades for an elementary statistics course: 23 60 79 32 57 74 52 70 82 36 80 77 81 95 41 65 92 85 55 76 52 10 64 75 78 25 80 98 81 67 41 71 83 54 64 72 88 62 74 43 60 78 89 76 84 48 84 90 15 79 34 67 17 82 69 74 63 80 85 61 Calculate: Stem and leaf Relative frequency histogram Cumulative frequency Sample Mean Sample Median Mode Variance Standard deviation
02 The following scores represent the final examination grades for an elementary statistics course: 23 60...
 02 The following scores represent the final examination grades for an elementary statistics course: 23 60 79 32 57 74 52 70 82 36 80 77 81 95 41 65 92 85 55 76 52 10 64 75 78 25 80 98 81 67 41 71 83 54 64 72 88 62 74 43 60 78 89 76 84 48 84 90 15 79 34 67 17 82 69 74 63 80 85 61 Calculate: . Stem and leaf ....
a professor grades students on three tests, four quizzes, and a final examination. each test counts...
a professor grades students on three tests, four quizzes, and a final examination. each test counts as two quizzes and the final examination counts as two tests. sara has test scores of 64,84,75. saras quiz scores are 94,87,93,92, her final examination score is 64. use the weighted mean formula to find saras average for the course. round your answer to one decimal place
2. (1.18) The following scores represent the final examination grades for an elementary statistics course: 33...
 2. (1.18) The following scores represent the final examination grades for an elementary statistics course: 33 60 79 32 57 74 52 70 82 36 80 77 81 95 41 65 92 85 55 76 52 30 64 75 78 35 80 98 81 67 a) Construct a Stem-and-Leaf Plot for the examination grades. b) Construct a Relative Frequency Histogram with 6 Class Intervals (that is: 6 rectangles) c) Compute the Sample Median Median. ) What is the Sample Mode?
 02 The following scores represent the final examination grades for an elementary statistics course: 23 60 79 32 57 74 52 70 82 36 80 77 81 95 41 65 92 85 55 76 52 10 64 75 78 25 80 98 81 67 41 71 83 54 64 72 88 62 74 43 60 78 89 76 84 48 84 90 15 79 34 67 17 82 69 74 63 80 85 61 Calculate: . Stem and leaf ....
 2. (1.18) The following scores represent the final examination grades for an elementary statistics course: 33 60 79 32 57 74 52 70 82 36 80 77 81 95 41 65 92 85 55 76 52 30 64 75 78 35 80 98 81 67 a) Construct a Stem-and-Leaf Plot for the examination grades. b) Construct a Relative Frequency Histogram with 6 Class Intervals (that is: 6 rectangles) c) Compute the Sample Median Median. ) What is the Sample Mode?
Most questions answered within 3 hours.
-
Home Corporation will open a new store on January 1. Based on
experience from its other...
asked 9 minutes ago -
In a neoclassical model, use the IS-LM to analyze the effect of
a permanent money supply...
asked 43 minutes ago -
An electron passes through a point 2.67 cm from a long straight
wire as it moves...
asked 1 hour ago -
A grammar is a 4-tuple G, G = (Ν, Σ, Π, Σ, S) where, Ν is...
asked 2 hours ago -
In this part, calculate the present values. Use the Excel PV
function to compute the present...
asked 2 hours ago -
Part 1. Primitive Types, Sorting, Recursion for
Homework.java
a) Implement the static method initializeArray that receives...
asked 3 hours ago -
Using C++, build a sorter that can rank a sequence of numbers in
a descending order....
asked 3 hours ago -
Derive ground state term symbols. Use notation 2S(1/2) for state
2S1/2
a) d5
b) f3
c)...
asked 3 hours ago -
A sample of size 31 will be drawn from a population with mean 39
and standard...
asked 4 hours ago -
What is the effect on the P-value when a test is changed from a
two-tailed hypothesis...
asked 4 hours ago -
I wish to estimate µ, the mean of a population. After I collect
and an-
alyze...
asked 4 hours ago -
At a local university, you poll a group of 115 students and find
that 37 of...
asked 4 hours ago