


Homework Answers
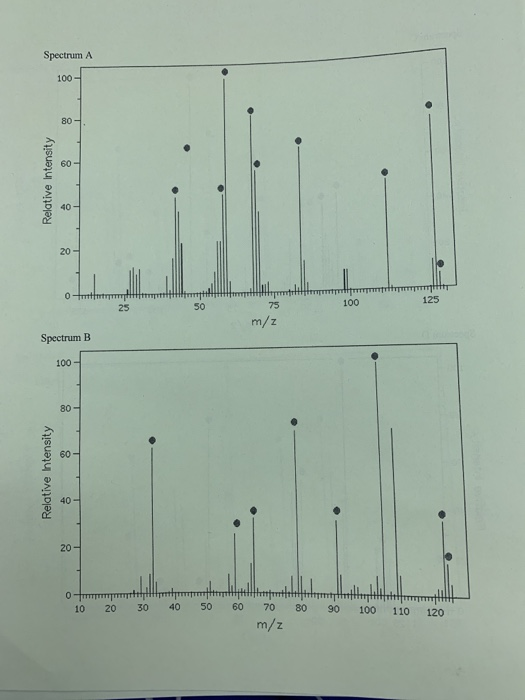
In mass spectrum the peak with highest m/z value is called as molecular ion peak. That mass is called as molecular ion mass.
Molecular formula of the given compound is C7H13NO.
Molar mass of the compound is,
7(C)+13(H)+1(N)+1(O)
= 7(12)+13(1(+1(14)+1(16)
= 84+13+14+16
=127
The 13C atom M+1 peak molar mass is 128
Hence the molecular ion (M) peak m/z is 127.
Eliminate the spectrums which are not having molecular ion peak at 127.
Therefore the correct option is spectrum A.
Add Answer to:
Please match the compound to its spectrum and explain
why
cpd 22 Spectrum A 100- 60...
Match each compound (d) to its mass spectrum (1-4). ) Relativel y 30 40 50 60...
 Match each compound (d) to its mass spectrum (1-4). ) Relativel y 30 40 50 60 70 80 90 100 110 120 18 Mars plastic 2 STAEDTLER Revente 20 30 40 50 60 70 80 90 100 110 120 130 Relative intensy 10 20 30 40 50 60 70 80 90 100 110 120 130
Use the mass spectrum and either the NMR spectrum or the IR spectrum to deduce the...
 Use the mass spectrum and either the NMR spectrum or the IR
spectrum to deduce the structure of the following compound
(c) C8HO3H NMR, 300 MHz, 6.1 ppm (singlet, 2H), 6.9 ppm (doublet, 1H), and 7.3 ppm (singlet, 1H), 7.4 ppm (doublet, 1H), 9.8 ppm (singlet, 1H); significant IR absorbances at 1687, 1602, 1449, 1264, 1038, 929, and 815 cm1. 100 149 (150) 80 60 40 121 63 20 65 91 0 15 20 25 30 35 40 45 50...
Use the mass spectrum and either the NMR spectrum or the IR
spectrum to deduce the structure of the following compound
(c) C8HO3H NMR, 300 MHz, 6.1 ppm (singlet, 2H), 6.9 ppm (doublet, 1H), and 7.3 ppm (singlet, 1H), 7.4 ppm (doublet, 1H), 9.8 ppm (singlet, 1H); significant IR absorbances at 1687, 1602, 1449, 1264, 1038, 929, and 815 cm1. 100 149 (150) 80 60 40 121 63 20 65 91 0 15 20 25 30 35 40 45 50...
Deduce the ester compound structure with M/Z=136 on this mass spectrum; significant peaks at 51, 77,...
 Deduce the ester compound structure with M/Z=136 on this mass
spectrum; significant peaks at 51, 77, 105, 136.
Relative Abundance M(136) 25 30 35 40 45 50 55 60 65 70 75 80 85 90 95 100 105 110 115 120 125 130 135 140 mz
Deduce the ester compound structure with M/Z=136 on this mass
spectrum; significant peaks at 51, 77, 105, 136.
Relative Abundance M(136) 25 30 35 40 45 50 55 60 65 70 75 80 85 90 95 100 105 110 115 120 125 130 135 140 mz
Suggest a composition for the halogen compound whose mass spectrum is shown below and assign the labeled peaks. 127 100 173 160 158 162 25 48 TITTHTT 160 170 91 208 79 35 160 173 30 40 50 60 70 80 90...
 Suggest a composition for the halogen compound whose mass
spectrum is shown below and assign the labeled peaks.
127 100 173 160 158 162 25 48 TITTHTT 160 170 91 208 79 35 160 173 30 40 50 60 70 80 90 100 110 120 130 140 150 160 170 180 190 200 210 m/z
127 100 173 160 158 162 25 48 TITTHTT 160 170 91 208 79 35 160 173 30 40 50 60 70 80 90 100...
Suggest a composition for the halogen compound whose mass
spectrum is shown below and assign the labeled peaks.
127 100 173 160 158 162 25 48 TITTHTT 160 170 91 208 79 35 160 173 30 40 50 60 70 80 90 100 110 120 130 140 150 160 170 180 190 200 210 m/z
127 100 173 160 158 162 25 48 TITTHTT 160 170 91 208 79 35 160 173 30 40 50 60 70 80 90 100...
8. (10 points) The following spectra correspond to compounds AE listed below con pound to its...
 8. (10 points) The following spectra correspond to compounds AE listed below con pound to its corresponding spestre Label very simal on the spectrum (as Co . ctc.). Spectrum CDCI, 190 160 170 160 150 140 130 120 110 100 80 80 Spectrum 2 70 80 50 40 30 20 10 O le CDCI, 190 180 170 180 150 140 130 120 110 100 90 80 70 60 50 40 30 20 10 O de CDCI, 190 180 170 180...
Please explain the answer in details. 2. [5 marks] Use the mass spectrum (EI-MS) and the...
 Please explain the answer in details.
2. [5 marks] Use the mass spectrum (EI-MS) and the additional 'H NMR data to deduce the structure of the compound of the formula CgH603. 100 - 149 м (150) Relative Abundance (percent) 0+ரார்ராராராரா T ITIIIIIIIIIIIIIIIIINITITTITTTTTTTTTTTTTTTTTTTTTin 15 20 25 30 35 40 45 50 55 60 65 70 75 80 85 90 95 100 105 110 115 120 125 130 135 140 145 150 155 mz doublet singlet doublet
Please explain the answer in details.
2. [5 marks] Use the mass spectrum (EI-MS) and the additional 'H NMR data to deduce the structure of the compound of the formula CgH603. 100 - 149 м (150) Relative Abundance (percent) 0+ரார்ராராராரா T ITIIIIIIIIIIIIIIIIINITITTITTTTTTTTTTTTTTTTTTTTTin 15 20 25 30 35 40 45 50 55 60 65 70 75 80 85 90 95 100 105 110 115 120 125 130 135 140 145 150 155 mz doublet singlet doublet
sro Refer to the mass spectrum of 2-methylbutae shown below to za tebe 100- 80 60...
 sro Refer to the mass spectrum of 2-methylbutae shown below to za tebe 100- 80 60 Relative htensity 40 20 72 0 10 20 30 40 50 80 90 100 110 12 80 70 m/z The peak at a mz of represents the following species. -CH.CH
Using these spectra, identify the unknown compound and its structure. Explain your analysis of each spectrum....
 Using these spectra, identify the unknown compound and its
structure. Explain your analysis of each spectrum.
/H d 3H 3H 12 11 10 1 4 2 0 ppm 40 60 100 80 120 140 160 180 200 ppm -20 -O 100- 80- M 20 M 0mttT 10 20 30 40 50 100 120 60 70 80 90 110 m/z L00 50 1000 200 3000 AVENUMEERI-i 4000 44 620 962 1288 31 62 1778 13 596 84 3664 923 1270 74...
Using these spectra, identify the unknown compound and its
structure. Explain your analysis of each spectrum.
/H d 3H 3H 12 11 10 1 4 2 0 ppm 40 60 100 80 120 140 160 180 200 ppm -20 -O 100- 80- M 20 M 0mttT 10 20 30 40 50 100 120 60 70 80 90 110 m/z L00 50 1000 200 3000 AVENUMEERI-i 4000 44 620 962 1288 31 62 1778 13 596 84 3664 923 1270 74...
Please label the peaks of the following graphs for the compound Acetophenone 100 Relative Intensity 100...
 Please label the peaks of the following graphs for the compound
Acetophenone
100 Relative Intensity 100 110 120 Ortofritt 10 20 30 40 50 60 70 80 90 m/z f. NMR Spectrum: 11 10 9 8 5 4 2 1 ppm g. IR Spectrum: THESE TERCEIP HAVENUMERI
Please label the peaks of the following graphs for the compound
Acetophenone
100 Relative Intensity 100 110 120 Ortofritt 10 20 30 40 50 60 70 80 90 m/z f. NMR Spectrum: 11 10 9 8 5 4 2 1 ppm g. IR Spectrum: THESE TERCEIP HAVENUMERI
Draw the structure with the mass spectrum and NMR. 151) (Mass of molecular ion: 100e-1N-7213 80...
 Draw the structure with the mass spectrum and NMR.
151) (Mass of molecular ion: 100e-1N-7213 80 60 2 40- 20- 0 100 150 125 75 25 50 m/z Molecular Weight: 151.1195 Elemental Analysis: C, 55.63; H, 3.33; N, 9.27; O, 31.76 170 160 150 140 130 120 110 100 80 70 30 20 10 10 .5 9.0 8.5 8.0 7.5 70 6.5 6.0 5.5 5.0 4.5 4.0 3.5 3.0 25 2.0 1.5 10 0.5 0.0 0.5 1.0 -15 2.0 2.5...
Draw the structure with the mass spectrum and NMR.
151) (Mass of molecular ion: 100e-1N-7213 80 60 2 40- 20- 0 100 150 125 75 25 50 m/z Molecular Weight: 151.1195 Elemental Analysis: C, 55.63; H, 3.33; N, 9.27; O, 31.76 170 160 150 140 130 120 110 100 80 70 30 20 10 10 .5 9.0 8.5 8.0 7.5 70 6.5 6.0 5.5 5.0 4.5 4.0 3.5 3.0 25 2.0 1.5 10 0.5 0.0 0.5 1.0 -15 2.0 2.5...
 Match each compound (d) to its mass spectrum (1-4). ) Relativel y 30 40 50 60 70 80 90 100 110 120 18 Mars plastic 2 STAEDTLER Revente 20 30 40 50 60 70 80 90 100 110 120 130 Relative intensy 10 20 30 40 50 60 70 80 90 100 110 120 130
 Use the mass spectrum and either the NMR spectrum or the IR
spectrum to deduce the structure of the following compound
(c) C8HO3H NMR, 300 MHz, 6.1 ppm (singlet, 2H), 6.9 ppm (doublet, 1H), and 7.3 ppm (singlet, 1H), 7.4 ppm (doublet, 1H), 9.8 ppm (singlet, 1H); significant IR absorbances at 1687, 1602, 1449, 1264, 1038, 929, and 815 cm1. 100 149 (150) 80 60 40 121 63 20 65 91 0 15 20 25 30 35 40 45 50...
Use the mass spectrum and either the NMR spectrum or the IR
spectrum to deduce the structure of the following compound
(c) C8HO3H NMR, 300 MHz, 6.1 ppm (singlet, 2H), 6.9 ppm (doublet, 1H), and 7.3 ppm (singlet, 1H), 7.4 ppm (doublet, 1H), 9.8 ppm (singlet, 1H); significant IR absorbances at 1687, 1602, 1449, 1264, 1038, 929, and 815 cm1. 100 149 (150) 80 60 40 121 63 20 65 91 0 15 20 25 30 35 40 45 50...
 Deduce the ester compound structure with M/Z=136 on this mass
spectrum; significant peaks at 51, 77, 105, 136.
Relative Abundance M(136) 25 30 35 40 45 50 55 60 65 70 75 80 85 90 95 100 105 110 115 120 125 130 135 140 mz
Deduce the ester compound structure with M/Z=136 on this mass
spectrum; significant peaks at 51, 77, 105, 136.
Relative Abundance M(136) 25 30 35 40 45 50 55 60 65 70 75 80 85 90 95 100 105 110 115 120 125 130 135 140 mz
 Suggest a composition for the halogen compound whose mass
spectrum is shown below and assign the labeled peaks.
127 100 173 160 158 162 25 48 TITTHTT 160 170 91 208 79 35 160 173 30 40 50 60 70 80 90 100 110 120 130 140 150 160 170 180 190 200 210 m/z
127 100 173 160 158 162 25 48 TITTHTT 160 170 91 208 79 35 160 173 30 40 50 60 70 80 90 100...
Suggest a composition for the halogen compound whose mass
spectrum is shown below and assign the labeled peaks.
127 100 173 160 158 162 25 48 TITTHTT 160 170 91 208 79 35 160 173 30 40 50 60 70 80 90 100 110 120 130 140 150 160 170 180 190 200 210 m/z
127 100 173 160 158 162 25 48 TITTHTT 160 170 91 208 79 35 160 173 30 40 50 60 70 80 90 100...
 8. (10 points) The following spectra correspond to compounds AE listed below con pound to its corresponding spestre Label very simal on the spectrum (as Co . ctc.). Spectrum CDCI, 190 160 170 160 150 140 130 120 110 100 80 80 Spectrum 2 70 80 50 40 30 20 10 O le CDCI, 190 180 170 180 150 140 130 120 110 100 90 80 70 60 50 40 30 20 10 O de CDCI, 190 180 170 180...
 Please explain the answer in details.
2. [5 marks] Use the mass spectrum (EI-MS) and the additional 'H NMR data to deduce the structure of the compound of the formula CgH603. 100 - 149 м (150) Relative Abundance (percent) 0+ரார்ராராராரா T ITIIIIIIIIIIIIIIIIINITITTITTTTTTTTTTTTTTTTTTTTTin 15 20 25 30 35 40 45 50 55 60 65 70 75 80 85 90 95 100 105 110 115 120 125 130 135 140 145 150 155 mz doublet singlet doublet
Please explain the answer in details.
2. [5 marks] Use the mass spectrum (EI-MS) and the additional 'H NMR data to deduce the structure of the compound of the formula CgH603. 100 - 149 м (150) Relative Abundance (percent) 0+ரார்ராராராரா T ITIIIIIIIIIIIIIIIIINITITTITTTTTTTTTTTTTTTTTTTTTin 15 20 25 30 35 40 45 50 55 60 65 70 75 80 85 90 95 100 105 110 115 120 125 130 135 140 145 150 155 mz doublet singlet doublet
 sro Refer to the mass spectrum of 2-methylbutae shown below to za tebe 100- 80 60 Relative htensity 40 20 72 0 10 20 30 40 50 80 90 100 110 12 80 70 m/z The peak at a mz of represents the following species. -CH.CH
 Using these spectra, identify the unknown compound and its
structure. Explain your analysis of each spectrum.
/H d 3H 3H 12 11 10 1 4 2 0 ppm 40 60 100 80 120 140 160 180 200 ppm -20 -O 100- 80- M 20 M 0mttT 10 20 30 40 50 100 120 60 70 80 90 110 m/z L00 50 1000 200 3000 AVENUMEERI-i 4000 44 620 962 1288 31 62 1778 13 596 84 3664 923 1270 74...
Using these spectra, identify the unknown compound and its
structure. Explain your analysis of each spectrum.
/H d 3H 3H 12 11 10 1 4 2 0 ppm 40 60 100 80 120 140 160 180 200 ppm -20 -O 100- 80- M 20 M 0mttT 10 20 30 40 50 100 120 60 70 80 90 110 m/z L00 50 1000 200 3000 AVENUMEERI-i 4000 44 620 962 1288 31 62 1778 13 596 84 3664 923 1270 74...
 Please label the peaks of the following graphs for the compound
Acetophenone
100 Relative Intensity 100 110 120 Ortofritt 10 20 30 40 50 60 70 80 90 m/z f. NMR Spectrum: 11 10 9 8 5 4 2 1 ppm g. IR Spectrum: THESE TERCEIP HAVENUMERI
Please label the peaks of the following graphs for the compound
Acetophenone
100 Relative Intensity 100 110 120 Ortofritt 10 20 30 40 50 60 70 80 90 m/z f. NMR Spectrum: 11 10 9 8 5 4 2 1 ppm g. IR Spectrum: THESE TERCEIP HAVENUMERI
 Draw the structure with the mass spectrum and NMR.
151) (Mass of molecular ion: 100e-1N-7213 80 60 2 40- 20- 0 100 150 125 75 25 50 m/z Molecular Weight: 151.1195 Elemental Analysis: C, 55.63; H, 3.33; N, 9.27; O, 31.76 170 160 150 140 130 120 110 100 80 70 30 20 10 10 .5 9.0 8.5 8.0 7.5 70 6.5 6.0 5.5 5.0 4.5 4.0 3.5 3.0 25 2.0 1.5 10 0.5 0.0 0.5 1.0 -15 2.0 2.5...
Draw the structure with the mass spectrum and NMR.
151) (Mass of molecular ion: 100e-1N-7213 80 60 2 40- 20- 0 100 150 125 75 25 50 m/z Molecular Weight: 151.1195 Elemental Analysis: C, 55.63; H, 3.33; N, 9.27; O, 31.76 170 160 150 140 130 120 110 100 80 70 30 20 10 10 .5 9.0 8.5 8.0 7.5 70 6.5 6.0 5.5 5.0 4.5 4.0 3.5 3.0 25 2.0 1.5 10 0.5 0.0 0.5 1.0 -15 2.0 2.5...
Most questions answered within 3 hours.
-
Using H and T, describe the Event of getting at least one H in
the two...
asked 1 minute ago -
Mean is 500, Standard Deviation is 80.
Question:
If 1,100 students had a score of 600...
asked 2 minutes ago -
Why are coenzymes necessary for chemical reactions?
Coenzymes are responsible for carrying substrates to the active...
asked 8 minutes ago -
4. Using the mks units (meters-kilograms-seconds), suppose you
have a spring with spring constant
4 N/m....
asked 21 minutes ago -
On July 9, Mifflin Company receives an $9,100, 120-day, 6% note
from customer Payton Summers as...
asked 17 minutes ago -
Sodium acetate gives potato chips a salt an vinegar flavor.
Which statement is true of a...
asked 22 minutes ago -
. Discuss the proposition that most expatriate selection
decisions are made informally, as suggested by the...
asked 27 minutes ago -
Prognosis, specifically how Agoraphobia disorder will
affect the person throughout the remainder of his or her...
asked 42 minutes ago -
Python Error: Writing a program to complete the
following:
Prompt the user for the name of...
asked 41 minutes ago -
4. You plan to retire in 35 years and would like to have $1.5
million in...
asked 50 minutes ago -
do
you believe that you have a moral obligation to try to help
counteract global warming?...
asked 52 minutes ago -
true or false in JAVA
1) A literal value is a value that is typed directly...
asked 55 minutes ago