
Homework Answers
Let write data in order
25 35 43 44 47 48 54 55 56 57
59 62 63 65 66 68 69 69 71 72
72 73 74 76 77 77 78 79 80 81
82 82 83 85 89 92 93 94 97 98
1st Quartile is given as..
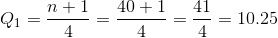
10.25th Observation =10th Obs + 0.25( 11th Obs - 10th Obs )
10.25th Observation =57+0.25(59-57)= 57.5


30th Observation =30th Obs + 0.75( 31th Obs - 30th Obs )
10.25th Observation =81+0.75(82-81)= 81.75


Add Answer to:
The ages at death for a sample of 40 residents who died in certain city are...
Find the indicated measure. The test scores of 40 students are listed below. Find P85.
Find the indicated measure. The test scores of 40 students are listed below. Find P85. 30 35 43 44 47 48 54 55 56 57 59 62 63 65 66 68 69 69 71 72 72 73 74 76 77 77 78 79 80 81 81 82 83 85 89 92 93 94 97 98 1) 85 2) 87 3) 89 4) 34
Find the indicated measure. The test scores of 40 students are listed below. Find P85. 30...
 Find the indicated measure. The test scores of 40 students are listed below. Find P85. 30 35 43 44 47 48 54 55 56 57 59 62 63 65 66 68 69 69 71 72 72 73 74 76 77 77 78 79 80 81 81 82 83 85 89 92 93 94 97 98 1) 85 2) 87 3) 89 4) 34
Consider the below matrixA, which you can copy and paste directly into Matlab.
Problem #1: Consider the below matrix A, which you can copy and paste directly into Matlab. The matrix contains 3 columns. The first column consists of Test #1 marks, the second column is Test # 2 marks, and the third column is final exam marks for a large linear algebra course. Each row represents a particular student.A = [36 45 75 81 59 73 77 73 73 65 72 78 65 55 83 73 57 78 84 31 60 83...
Question 1 15 pts Test scores for a class of 40 students are listed below: 25...
 Question 1 15 pts Test scores for a class of 40 students are listed below: 25 35 43 44 47 48 54 55 56 57 59 62 63 65 66 68 69 69 71 72 72 73 74 76 77 77 78 79 80 81 81 82 83 85 89 92 93 94 97 98 a) The mean of the sample data is b) The median of the sample data is c) The standard deviation of the sample data is...
Use the Grouped Distribution method for the following exercise (see Self-Test 2-4 for detailed instructions), rounding...
Use the Grouped Distribution method for the following exercise (see Self-Test 2-4 for detailed instructions), rounding each answer to the nearest whole number. Using the frequency distribution below (scores on a statistics exam taken by 80 students), determine:ion 1 of the preliminary test (scores on a statistics exam taken by 80 students), determine: 68 84 75 82 68 90 62 88 76 93 73 79 88 73 60 93 71 59 85 75 61 65 75 87 74 62 95...
1. Forecast demand for Year 4. a. Explain what technique you utilized to forecast your demand....
 1. Forecast demand for Year 4.
a. Explain what technique you utilized to forecast your
demand.
b. Explain why you chose this technique over others.
Year 3 Year 1 Year 2 Actual Actual Actual Forecast Forecast Forecast Demand Demand Demand Week 1 52 57 63 55 66 77 Week 2 49 58 68 69 75 65 Week 3 47 50 58 65 80 74 Week 4 60 53 58 55 78 67 57 Week 5 49 57 64 76 77...
1. Forecast demand for Year 4.
a. Explain what technique you utilized to forecast your
demand.
b. Explain why you chose this technique over others.
Year 3 Year 1 Year 2 Actual Actual Actual Forecast Forecast Forecast Demand Demand Demand Week 1 52 57 63 55 66 77 Week 2 49 58 68 69 75 65 Week 3 47 50 58 65 80 74 Week 4 60 53 58 55 78 67 57 Week 5 49 57 64 76 77...
Use the accompanying data set on the pulse rates (in beats per minute) of males to...
Use the accompanying data set on the pulse rates (in beats per minute) of males to complete parts (a) and (b) below. LOADING... Click the icon to view the pulse rates of males. a. Find the mean and standard deviation, and verify that the pulse rates have a distribution that is roughly normal. The mean of the pulse rates is 71.871.8 beats per minute. (Round to one decimal place as needed.) The standard deviation of the pulse rates is 12.212.2...
Use this set of 40 exam scores as the POPULATION for this activity: (put them into...
Use this set of 40 exam scores as the POPULATION for this activity: (put them into List 1 in your calculator) 67 90 74 66 76 79 77 53 86 86 68 81 72 57 79 78 50 66 77 66 81 79 80 73 71 56 81 86 62 69 81 78 77 80 88 62 67 62 74 94 Use this set of 40 exam scores as the POPULATION for this activity: (put them into List 1 in...
1. Ages of Vice Presidents at the Time of Their Death. The ages at the time...
 1. Ages of Vice Presidents at the Time of Their Death. The ages at the time of death of those Vice Presidents of the United States who have passed away are listed below. Do the following: a. Use the data to construct a frequency distribution. Use 6 classes. b. Find the relative frequency for the frequency distribution. c. Construct a histogram, frequency polygon, and ogive for the data. d. Construct a histogram, frequency polygon, and ogive using relative frequencies for...
 Find the indicated measure. The test scores of 40 students are listed below. Find P85. 30 35 43 44 47 48 54 55 56 57 59 62 63 65 66 68 69 69 71 72 72 73 74 76 77 77 78 79 80 81 81 82 83 85 89 92 93 94 97 98 1) 85 2) 87 3) 89 4) 34
 Question 1 15 pts Test scores for a class of 40 students are listed below: 25 35 43 44 47 48 54 55 56 57 59 62 63 65 66 68 69 69 71 72 72 73 74 76 77 77 78 79 80 81 81 82 83 85 89 92 93 94 97 98 a) The mean of the sample data is b) The median of the sample data is c) The standard deviation of the sample data is...
 1. Forecast demand for Year 4.
a. Explain what technique you utilized to forecast your
demand.
b. Explain why you chose this technique over others.
Year 3 Year 1 Year 2 Actual Actual Actual Forecast Forecast Forecast Demand Demand Demand Week 1 52 57 63 55 66 77 Week 2 49 58 68 69 75 65 Week 3 47 50 58 65 80 74 Week 4 60 53 58 55 78 67 57 Week 5 49 57 64 76 77...
1. Forecast demand for Year 4.
a. Explain what technique you utilized to forecast your
demand.
b. Explain why you chose this technique over others.
Year 3 Year 1 Year 2 Actual Actual Actual Forecast Forecast Forecast Demand Demand Demand Week 1 52 57 63 55 66 77 Week 2 49 58 68 69 75 65 Week 3 47 50 58 65 80 74 Week 4 60 53 58 55 78 67 57 Week 5 49 57 64 76 77...
 1. Ages of Vice Presidents at the Time of Their Death. The ages at the time of death of those Vice Presidents of the United States who have passed away are listed below. Do the following: a. Use the data to construct a frequency distribution. Use 6 classes. b. Find the relative frequency for the frequency distribution. c. Construct a histogram, frequency polygon, and ogive for the data. d. Construct a histogram, frequency polygon, and ogive using relative frequencies for...
Most questions answered within 3 hours.
-
From the literature (reference your sources): What are the
lattice parameters of calcite and aragonite? Why...
asked 38 minutes ago -
Your system is rejecting the question am asking which is
preceded by a case study. It...
asked 42 minutes ago -
3. On January 2, 2000, Larry creates a trust with himself as
trustee. Larry as trustee...
asked 39 minutes ago -
A member of the volleyball team spikes the ball. During this
process, she changes the velocity...
asked 46 minutes ago -
Are adult gamers less likely to use a gaming console (Xbox,
PlayStation, Wii, etc...) than teen...
asked 1 hour ago -
The University of
Texas recently reported that 43% of college students aged 18-24
would spend their...
asked 1 hour ago -
The length of stay at a specific emergency department in
Phoenix, Arizona, in 2009 had a...
asked 1 hour ago -
. Please give the mechanism for this type of problem. Step by
Step
The toxin that...
asked 1 hour ago -
If you have a 1M stock solution and you want to dilute 1 :10
with water,...
asked 1 hour ago -
In a load instruction, the effective address is obtained by
A) Retriving the address from a...
asked 1 hour ago -
Use the following information to answer this question.
Windswept, Inc. 2017 Income Statement ($ in millions)...
asked 1 hour ago -
A mutual fund salesperson has arranged to call on four people
tomorrow. Based on past experience...
asked 1 hour ago